

Reference gene selection for gene expression study in shell gland and spleen of laying hens challenged with infectious bronchitis virus
- PMID: 29079779
- PMCID: PMC5660252
- DOI: 10.1038/s41598-017-14693-2
Reference gene selection for gene expression study in shell gland and spleen of laying hens challenged with infectious bronchitis virus
Abstract
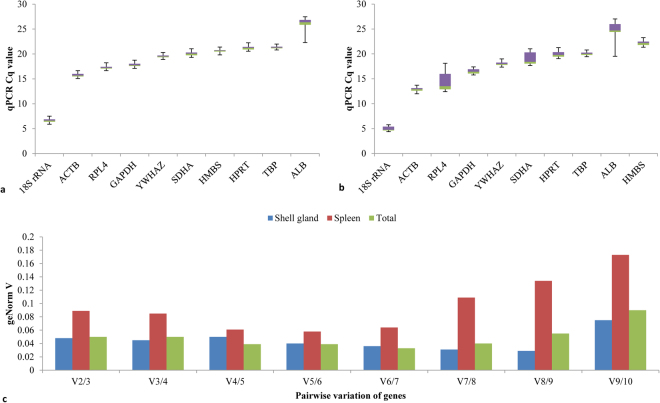
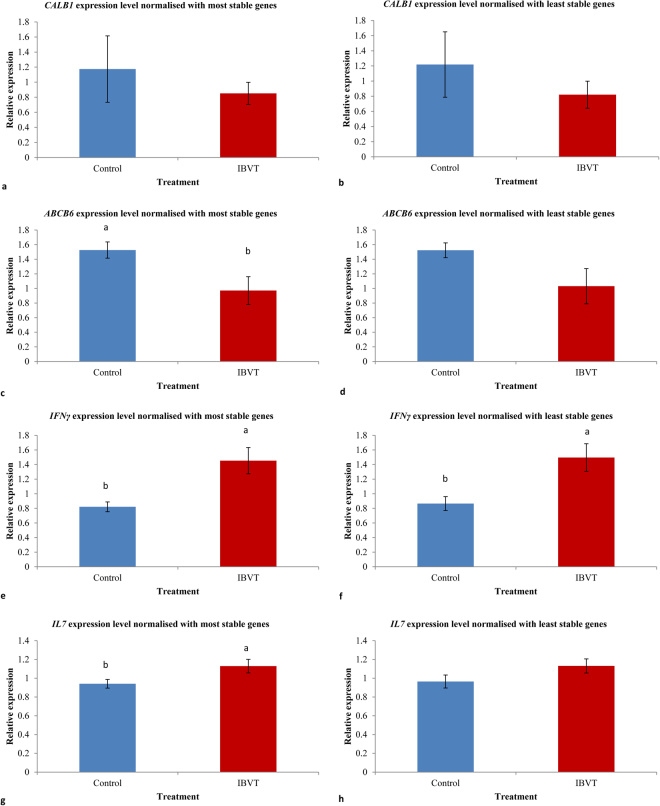
Ten reference genes were investigated for normalisation of candidate target gene expression data in the shell gland and spleen of laying hens challenged with two strains of infectious bronchitis virus (IBV). Data were analysed with geNorm, NormFinder and BestKeeper, and a comprehensive ranking (geomean) was calculated. In the combined data set of IBV challenged shell gland samples, the comprehensive ranking showed TATA-box binding protein (TBP) and tyrosine 3-monooxygenase/tryptophan 5-monooxygenase activation protein zeta (YWHAZ) as the two most stable, and succinate dehydrogenase complex flavoprotein subunit A (SDHA) and albumin (ALB) as the two least stable reference genes. In the spleen, and in the combined data set of the shell gland and spleen, the two most stable and the two least stable reference genes were TBP and YWHAZ, and ribosomal protein L4 (RPL4) and ALB, respectively. Different ranking has been due to different algorithms. Validation studies showed that the use of the two most stable reference genes produced accurate and more robust gene expression data. The two most and least stable reference genes obtained in the study, were further used for candidate target gene expression data normalisation of the shell gland and spleen under an IBV infection model.
Conflict of interest statement
The authors declare that they have no competing interests.
Figures
Similar articles
-
Genes involved in mitochondrial biogenesis and function may not show synchronised responses to mitochondria in shell gland of laying chickens under infectious bronchitis virus challenge.BMC Mol Cell Biol. 2019 Apr 1;20(1):3. doi: 10.1186/s12860-019-0190-7. BMC Mol Cell Biol. 2019. PMID: 31041887 Free PMC article.
-
Reference gene selection for the shell gland of laying hens in response to time-points of eggshell formation and nicarbazin.PLoS One. 2017 Jul 3;12(7):e0180432. doi: 10.1371/journal.pone.0180432. eCollection 2017. PLoS One. 2017. PMID: 28671969 Free PMC article.
-
Reference gene screening for analyzing gene expression in the heart, liver, spleen, lung and kidney of forest musk deer.J Vet Med Sci. 2021 Nov 16;83(11):1750-1759. doi: 10.1292/jvms.21-0281. Epub 2021 Oct 7. J Vet Med Sci. 2021. PMID: 34615843 Free PMC article.
-
Infectious bronchitis virus and brown shell colour: Australian strains of infectious bronchitis virus affect brown eggshell colour in commercial laying hens differently.Avian Pathol. 2016 Oct;45(5):552-8. doi: 10.1080/03079457.2016.1184744. Avian Pathol. 2016. PMID: 27163194
-
Severe acute respiratory syndrome vaccine development: experiences of vaccination against avian infectious bronchitis coronavirus.Avian Pathol. 2003 Dec;32(6):567-82. doi: 10.1080/03079450310001621198. Avian Pathol. 2003. PMID: 14676007 Free PMC article. Review.
Cited by
-
Reference gene selection for expression studies in the reproductive axis tissues of Magang geese at different reproductive stages under light treatment.Sci Rep. 2021 Apr 7;11(1):7573. doi: 10.1038/s41598-021-87169-z. Sci Rep. 2021. PMID: 33828187 Free PMC article.
-
Effects of Aeriscardovia aeriphila on growth performance, antioxidant functions, immune responses, and gut microbiota in broiler chickens.J Zhejiang Univ Sci B. 2023 Sep 22;24(11):1014-1026. doi: 10.1631/jzus.B2200621. J Zhejiang Univ Sci B. 2023. PMID: 37961803 Free PMC article.
-
Superiority of coarse eggshell as a calcium source over limestone, cockle shell, oyster shell, and fine eggshell in old laying hens.Sci Rep. 2021 Jun 24;11(1):13225. doi: 10.1038/s41598-021-92589-y. Sci Rep. 2021. PMID: 34168210 Free PMC article.
-
Investigation of chicken housekeeping genes using next-generation sequencing data.Front Genet. 2022 Sep 13;13:827538. doi: 10.3389/fgene.2022.827538. eCollection 2022. Front Genet. 2022. PMID: 36176302 Free PMC article.
-
Genes involved in mitochondrial biogenesis and function may not show synchronised responses to mitochondria in shell gland of laying chickens under infectious bronchitis virus challenge.BMC Mol Cell Biol. 2019 Apr 1;20(1):3. doi: 10.1186/s12860-019-0190-7. BMC Mol Cell Biol. 2019. PMID: 31041887 Free PMC article.
References
-
- Nys Y. Relationships between age, shell quality and individual rate and duration of shell formation in domestic hens. Br. Poult. Sci. 1986;27:253–259. doi: 10.1080/00071668608416878. - DOI
Publication types
MeSH terms
LinkOut - more resources
Full Text Sources
Other Literature Sources
Miscellaneous
