

Live cell X-ray imaging of autophagic vacuoles formation and chromatin dynamics in fission yeast
- PMID: 29061993
- PMCID: PMC5653777
- DOI: 10.1038/s41598-017-13175-9
Live cell X-ray imaging of autophagic vacuoles formation and chromatin dynamics in fission yeast
Abstract
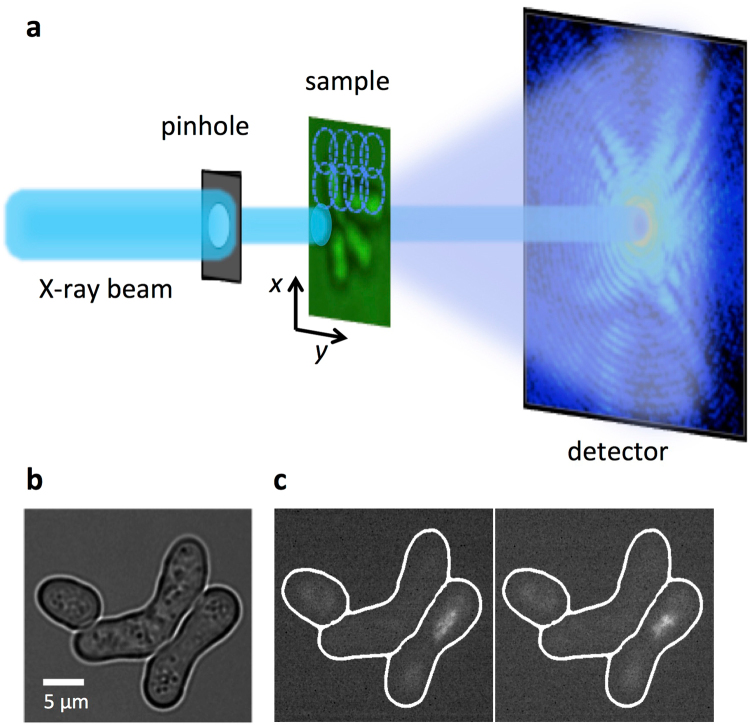
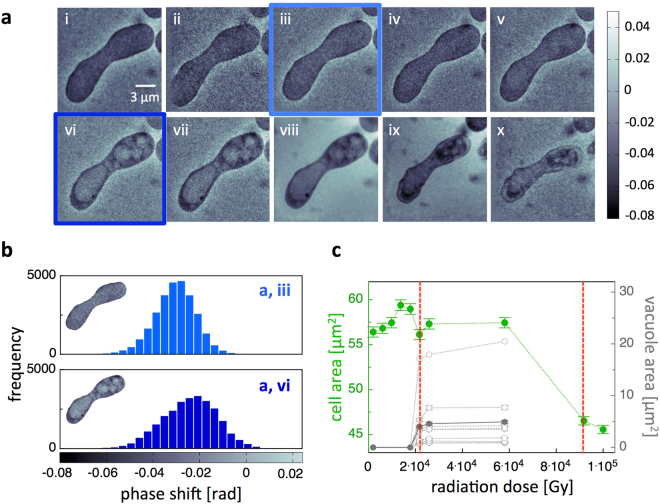
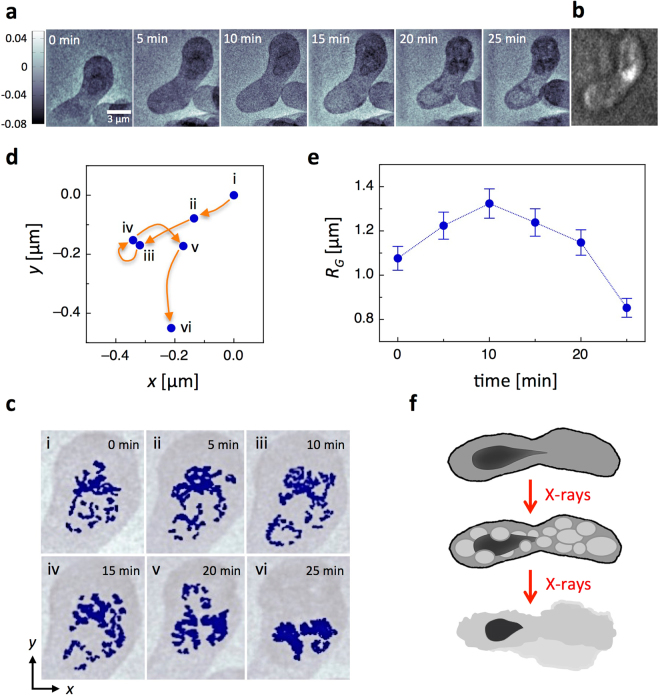
Seeing physiological processes at the nanoscale in living organisms without labeling is an ultimate goal in life sciences. Using X-ray ptychography, we explored in situ the dynamics of unstained, living fission yeast Schizosaccharomyces pombe cells in natural, aqueous environment at the nanoscale. In contrast to previous X-ray imaging studies on biological matter, in this work the eukaryotic cells were alive even after several ptychographic X-ray scans, which allowed us to visualize the chromatin motion as well as the autophagic cell death induced by the ionizing radiation. The accumulated radiation of the sequential scans allowed for the determination of a characteristic dose of autophagic vacuole formation and the lethal dose for fission yeast. The presented results demonstrate a practical method that opens another way of looking at living biological specimens and processes in a time-resolved label-free setting.
Conflict of interest statement
The authors declare that they have no competing interests.
Figures
Similar articles
-
Autophagy in the fission yeast Schizosaccharomyces pombe.FEBS Lett. 2010 Apr 2;584(7):1327-34. doi: 10.1016/j.febslet.2009.12.037. Epub 2009 Dec 27. FEBS Lett. 2010. PMID: 20036658 Review.
-
The ade6 gene of the fission yeast Schizosaccharomyces pombe has the same chromatin structure in the chromosome and in plasmids.Yeast. 1991 Aug-Sep;7(6):547-58. doi: 10.1002/yea.320070603. Yeast. 1991. PMID: 1767586
-
X-ray tomography of Schizosaccharomyces pombe.Differentiation. 2007 Jul;75(6):529-35. doi: 10.1111/j.1432-0436.2007.00180.x. Epub 2007 Apr 25. Differentiation. 2007. PMID: 17459084
-
3D visualization of subcellular structures of Schizosaccharomyces pombe by hard X-ray tomography.J Microsc. 2010 Oct;240(1):14-20. doi: 10.1111/j.1365-2818.2010.03379.x. J Microsc. 2010. PMID: 21050209
-
Centromere structure and function in budding and fission yeasts.New Biol. 1990 Jan;2(1):10-9. New Biol. 1990. PMID: 2078550 Review.
Cited by
-
X-ray phase-contrast tomography of cells manipulated with an optical stretcher.J Synchrotron Radiat. 2024 Jul 1;31(Pt 4):923-935. doi: 10.1107/S1600577524003618. Epub 2024 Jun 11. J Synchrotron Radiat. 2024. PMID: 38861370 Free PMC article.
References
Publication types
MeSH terms
Substances
LinkOut - more resources
Full Text Sources
Other Literature Sources
