. 2017 Nov 6;43(3):274-289.e5.
doi: 10.1016/j.devcel.2017.09.023. Epub 2017 Oct 19.

Hemodynamic Forces Sculpt Developing Heart Valves through a KLF2-WNT9B Paracrine Signaling Axis

Affiliations

Hemodynamic Forces Sculpt Developing Heart Valves through a KLF2-WNT9B Paracrine Signaling Axis

Lauren M Goddard et al. Dev Cell. .

Abstract

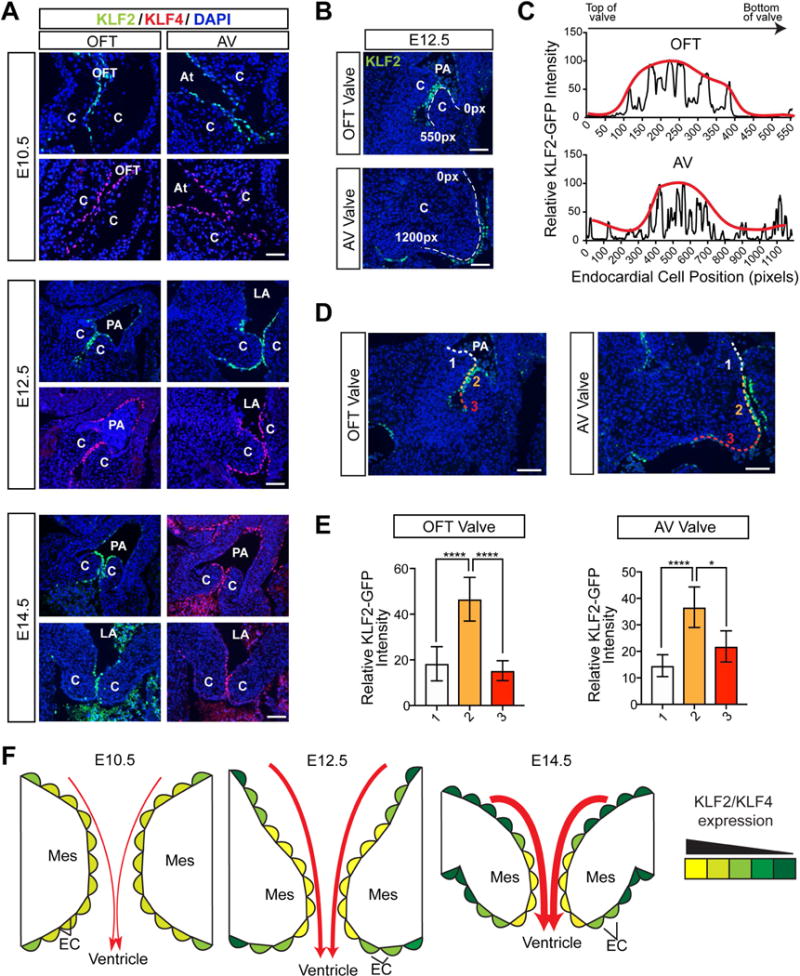
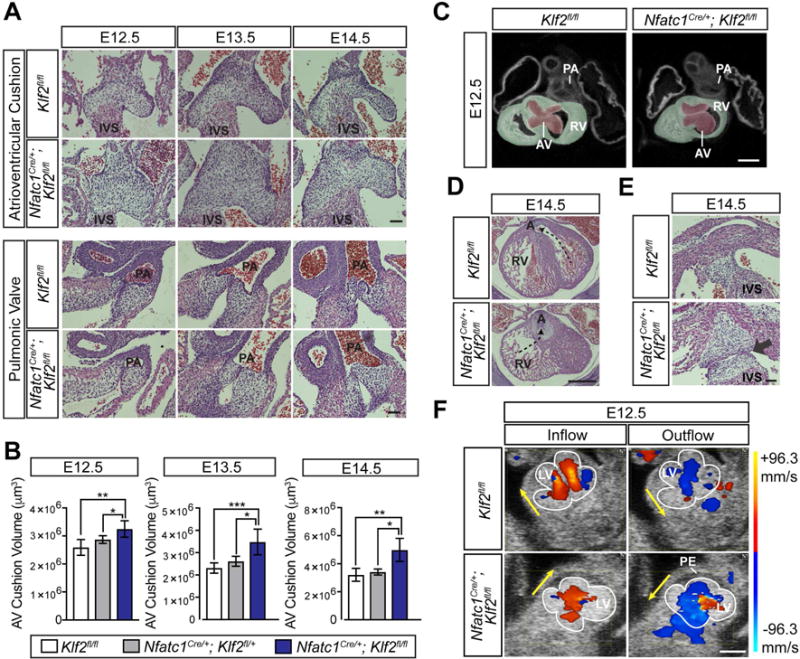
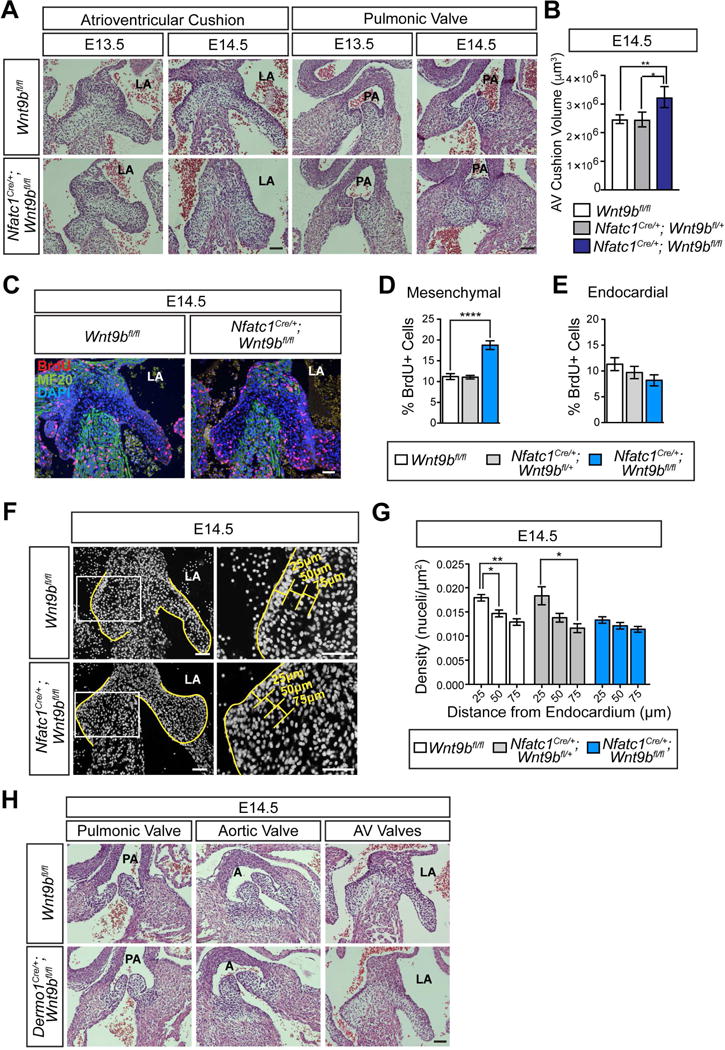
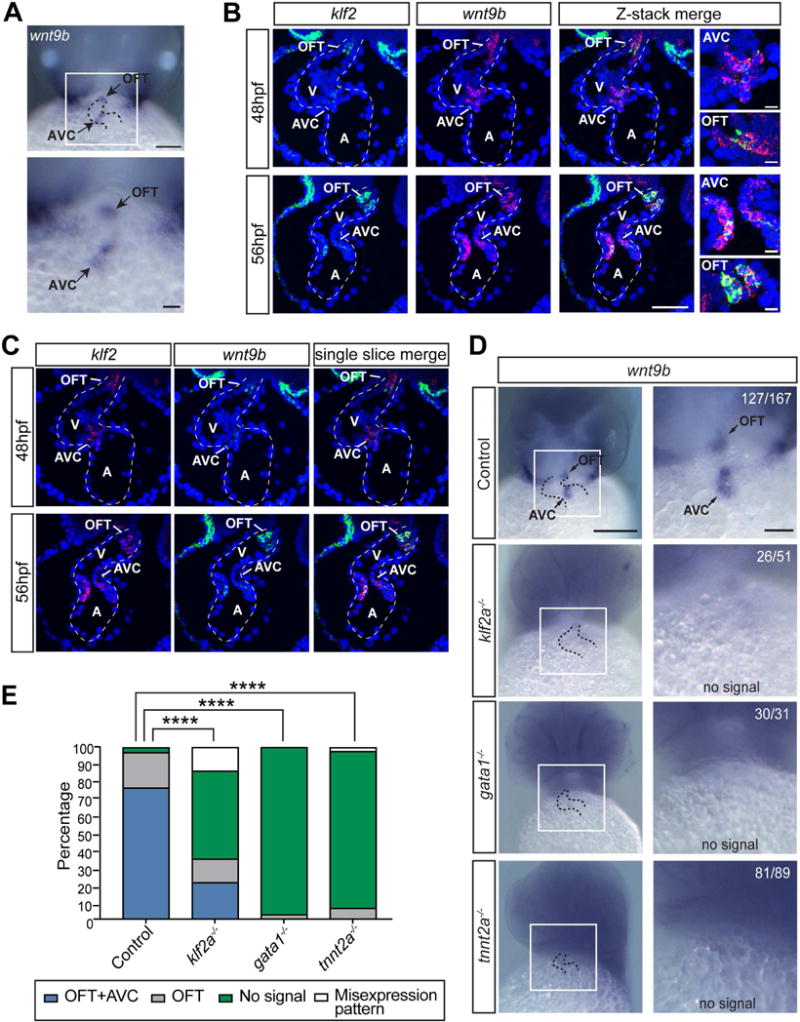
Hemodynamic forces play an essential epigenetic role in heart valve development, but how they do so is not known. Here, we show that the shear-responsive transcription factor KLF2 is required in endocardial cells to regulate the mesenchymal cell responses that remodel cardiac cushions to mature valves. Endocardial Klf2 deficiency results in defective valve formation associated with loss of Wnt9b expression and reduced canonical WNT signaling in neighboring mesenchymal cells, a phenotype reproduced by endocardial-specific loss of Wnt9b. Studies in zebrafish embryos reveal that wnt9b expression is similarly restricted to the endocardial cells overlying the developing heart valves and is dependent upon both hemodynamic shear forces and klf2a expression. These studies identify KLF2-WNT9B signaling as a conserved molecular mechanism by which fluid forces sensed by endothelial cells direct the complex cellular process of heart valve development and suggest that congenital valve defects may arise due to subtle defects in this mechanotransduction pathway.

Keywords: Klf2; Klf4; Wnt9b; cardiac cushion; endocardium; heart valve development; hemodynamic force.


Figures

Figure 1
Figure 1. Graded expression of KLF2 and KLF4 in the endocardial cells of the remodeling cardiac cushions
(A) KLF2 (green) and KLF4 (red) expression in developing heart valves were detected by immunostaining GFP-KLF2 hearts at E10.5, E12.5 and E14.5 with anti-GFP and anti-KLF4 antibodies. DAPI (blue) denotes nuclei. Scale bar represents 100μm. (B) Representative images showing how endocardial cell GFP-KLF2 (green) intensity along the cushion endocardium was calculated. White dotted lines indicate the relative positions of endocardial cells measured in pixels. (C) Representative plots showing endocardial GFP-KLF2 intensity across the OFT and AV cushions shown in (B). (D, E) Quantitation of variable, spatially determined GFP-KLF2 expression in the developing valves. Representative images of OFT and AV valves depicting how the KLF2-GFP (green) was quantified based on three defined zones as shown in (D): 1, artery/atrial side (predicted to have lower shear forces); 2, area of valve leaflet contact (predicted to have higher shear forces); 3, ventricular side (predicted to have lower shear forces). Scale bar represents 100μm. KLF2-GFP quantitation of the areas defined in (D) is shown in (E). Error bars represent ± SEM, * p≤0.05, **** p≤0.0001 using an unpaired 2-tailed Student’s t-test (n=4-5 from at least 2 litters). (F) Schematic depiction of KLF2/KLF4 expression in the endocardium overlying the developing AV valve between E10.5 and E14.5. Thickness of the red arrows indicates the relative strength of hemodynamic shear forces. At, atrium; C, cushion; EC, endocardial cell; LA, left atrium; Mes, mesenchyme; OFT, outflow tract; PA, pulmonary artery. See also Figure S1.
Figure 2
Figure 2. Endocardial loss of Klf2 results in cardiac cushion defects and abnormal intracardiac blood flow
(A) H-E staining of cardiac cushions in Nfatc1Cre/+; Klf2fl/fl and littermate control hearts between E12.5 and E14.5. (B) Quantitation of AV cushion volume in E12.5-E14.5 Nfatc1Cre/+; Klf2fl/fl mice compared to controls. Error bars represent ± SEM, * p≤0.05, **p≤0.01, *** p≤0.001 using an unpaired 2-tailed Student’s t-test (n=3-7 from 3-4 litters). (C) Optical tomography 2D X-axis images of E12.5 Nfatc1Cre/+; Klf2fl/fl hearts compared to controls. Red and green structures represent the atrioventricular cushion and ventricular myocardium respectively. Scale bar represents 200μm. (D) H-E images demonstrating the presence of DORV in Nfatc1Cre/+; Klf2fl/fl mice. Dotted lines denote the path of blood flow from the ventricle to the aorta in control and Nfatc1Cre/+; Klf2fl/fl animals. Scale bar represents 500μm. (E) H-E staining of the membranous septum in E14.5 control and Nfatc1Cre/+; Klf2fl/fl animals. Arrow indicates a septal defect in a Nfatc1Cre/+; Klf2fl/fl heart. Scale bar represents 100μm. (F) Color Doppler of E12.5 control and Nfatc1Cre/+; Klf2fl/fl littermates. Yellow arrows indicate the direction of blood flow. Solid white lines outline the fetal heart. Scale bar represents 500μm. A, aorta; AV, atrioventricular cushion; IVS, interventricular septum; LV, left ventricle; PA, pulmonary artery; PE, pericardial edema; RV, right ventricle. See also Figure S1, S2, Videos S1-4 and Table S1.
Figure 3
Figure 3. Cushion mesenchymal cell defects following endocardial Klf2 loss are cell non-autonomous
(A) Lineage tracing of Dermo1-Cre; R26RYFP cells (green) in the embryonic heart from E10.5 to E13.5. DAPI (blue) stains all nuclei. Scale bar represents 100μm. (B) H-E staining of cardiac OFT and AVC cushions in Dermo1Cre/+; Klf2fl/fl and littermate control hearts at E14.5. Scale bar represents 100μm. (C) Lineage tracing of Nfatc1enCre/+; R26REYFP mice in the hearts of E12.5 mice. White arrows indicate endocardial cells devoid of reporter activity lining the AV cushion. Scale bar represents 100μm. (D) Lineage tracing of Nfatc1enCre/+; R26RLacZ mice in the hearts of E16.5 mice. Black arrows indicate endocardial cells devoid of reporter activity lining the AV valve leaflets. Scale bar represents 100μm. (E) H-E staining of OFT and AV valves from E15.5 and E17.5 Nfatc1enCre/+;Klf2fl/fl and littermate controls. Note the enlarged pulmonic and aortic valve cushions compared with controls. Scale bar represents 200μm. A, aorta; AoV, aortic valve, C, cushion; IVS, interventricular septum; LA, left atrium; MV, mitral valve; PA, pulmonary artery; PuV, pulmonary valve; RA, right atrium. See also Table S1.
Figure 4
Figure 4. Endocardial loss of Klf2 results in altered mesenchymal cell proliferation and condensation in the cardiac cushion
(A) Immunostaining to detect BrdU+ cells (red) in Nfatc1Cre/+; Klf2fl/fl and littermate control hearts at E13.5. MF20 (green) marks heart muscle and DAPI (blue) denotes cell nuclei. (B, C) Quantitation of BrdU+ mesenchymal (B) and endocardial (C) cells in the AV cushion of E11.5-E14.5 control and Nfatc1Cre/+; Klf2fl/fl littermates. Error bars represent ± SEM. * p≤0.05, **p≤0.01 using an unpaired 2-tailed Student’s t-test (n=3-4 from at least 2 litters). (D) H-E staining of Nfatc1Cre/+; Klf2fl/fl and control AV cushions at E13.5. High magnification images of the white boxed regions are shown on the right. Bracket indicates the region of mesenchymal cell condensation in control cushions at this timepoint. (E) Mesenchymal cell condensation in the indicated AV cushions was calculated by measuring the number of mesenchymal cell nuclei (DAPI, white) per unit area at the indicated distances (yellow brackets) from the endocardium. High magnification images of the white boxed regions are shown on the right. (F-H) Quantitation of mesenchymal condensation at varying distances from the endocardium in AV cushions from Nfatc1Cre/+; Klf2fl/fl and littermate controls at E11.5, E12.5 and E13.5. Error bars represent ± SEM, * p≤0.05 using an unpaired 2-tailed Student’s t-test (n=3 from at least 2 litters). E, endocardium; IVS, interventricular septum; LA, left atrium; M, mesenchyme. All scale bars represent 100μm. See also Figures S2 and S3.
Figure 5
Figure 5. KLF2 regulates endocardial Wnt9b expression and canonical WNT signaling in mesenchymal cells of the developing valve
(A) Differential gene expression between E12.5 AV cushions from Klf2fl/fl mice and Nfatc1Cre/+; Klf2fl/fl mice was determined using RNA-seq analysis. Heat map displays the top 20 differentially expressed genes with a p-value ≤ 0.05 and an FDR ≤ 0.1. Red stars indicate known Wnt signaling genes. Each replicate consists of 6 AV cushions combined from 6 different litters. (B) Gene ontology analysis of all significant differentially expressed genes between Klf2fl/fl and Nfatc1Cre/+; Klf2fl/fl cushions. (C) qPCR measurement of Wnt target gene expression from the indicated E12.5 hearts. Error bars represent ± SEM, * p≤0.05, **p≤0.01, **** p≤0.0001 using an unpaired 2-tailed Student’s t-test (n=3-4 from at least 3 litters). (D) In situ hybridization for Wnt9b (red) in developing control OFT and AV valves between E10.5 and E13.5. DAPI (blue) staining denotes nuclei. Scale bar represents 100μm. (E) In situ hybridization for Wnt9b (red) in developing Nfatc1Cre/+; Klf2fl/fl and control valves at E13.5. DAPI (blue) staining denotes nuclei. Scale bar represents 100μm. (F) Axin2CreERT2-tdTomato reporter activity is detected in the indicated developing heart valves using anti-RFP immunostaining (red). Endocardial cells are identified using anti-PECAM staining (green). Scale bars represent 200μm. High magnification images from boxed regions are shown on the right. Scale bars in high magnification images represent 100μm. (G) qPCR of WNT9B and NOS3 gene expression in HMVECs following exposure to adenoviral vectors encoding LacZ or KLF2 and/or KLF4 for 24h. Error bars represent ± SEM, ***p≤0.001 using an unpaired 2-tailed Student’s t-test (n=3). A, aorta; C, cushion; LA, left atrium; PA, pulmonary artery. See also Figures S4 and S5.
Figure 6
Figure 6. Endocardial loss of Wnt9b confers valve defects like those observed with endocardial loss of Klf2
(A) H-E staining of developing AV and OFT valves in E13.5 and E14.5 Nfatc1Cre/+; Wnt9bfl/fl and control hearts is shown. (B) Quantitation of AV cushion volumes from Nfatc1Cre/+; Wnt9bfl/fl mice and littermate controls at E14.5. Error bars represent ± SEM, * p≤0.05, ** p≤0.01 using an unpaired 2-tailed Student’s t-test (n=4 from 3 litters). (C) Immunostaining to detect BrdU+ cells (red) in Nfatc1Cre/+; Wnt9bfl/fl and littermate control hearts at E14.5. MF20 (green) marks heart muscle and DAPI (blue) denotes cell nuclei. (D, E) Quantitation of BrdU+ mesenchymal (D) and endocardial (E) cells in the AV cushions of E14.5 Nfatc1Cre/+; Wnt9bfl/fl and littermate controls is shown. Error bars represent SEM, **** p≤0.0001 using and unpaired 2-tailed Student’s t-test (n=3-5 from at least 2 litters). (F) Mesenchymal cell condensation in E14.5 AV cushions was calculated by measuring the number of mesenchymal cell nuclei (DAPI, white) in a given area at indicated distances (yellow brackets) from the endocardium. Images on the right are higher magnification images of the white boxed regions. (G) Quantitation of mesenchymal condensation at varying distances from the AV cushion endocardium in E14.5 Nfatc1Cre/+; Wnt9bfl/fl hearts compared to littermate controls. Error bars represent ± SEM, *p≤0.05, **p≤0.01, ***p≤0.001 using an unpaired 2-tailed Student’s t-test (n=3-6 from at least 2 litters). (H) H-E staining of cardiac OFT and AVC cushions in Dermo1Cre/+; Wnt9bfl/fl and littermate control hearts at E14.5. Scale bar represents 100μm. A, aorta; LA, left atria, PA, pulmonary artery. All scale bars represent 100μm. See also Figure S6 and Table S1.
Figure 7
Figure 7. wnt9b expression in the developing zebrafish heart is regulated by hemodynamic shear forces
(A) Wholemount in situ hybridization for wnt9b in 48 hpf wild-type zebrafish embryos. Dotted lines outline the heart. Scale bars: top: 0.1mm; bottom: 0.03mm (B, C) In situ hybridization using RNAscope for klf2a and wnt9b in 48 hpf and 56 hpf wild-type zebrafish embryos is shown using merged Z-stack (B) and single slice (C) confocal analysis. (D) In situ hybridization to detect wnt9b expression in the developing AV cushion and outflow tract of 48 hpf wild-type fish (control), silent heart (tnnt2a−/−) mutants that lack blood flow, gata1 mutants (gata1−/−) that experience low shear stress due to low blood viscosity, and klf2a mutants (klf2a−/−) is shown. Dotted lines outline the heart. Scale bars: left, 0.2mm; right, 0.06mm. (E) The percentage of embryos in which wnt9b expression is normal, absent, or mis-expressed in the AVC or OFT is shown. The n for each group is indicated in D. **** indicates p<0.0001 using chi-square analysis. A, atrium; AVC, Atrioventricular cushion; OFT, Outflow tract; V, ventricle.

Similar articles

Cited by

References

    1. Alfieri CM, Cheek J, Chakraborty S, Yutzey KE. Wnt signaling in heart valve development and osteogenic gene induction. Dev Biol. 2010;338:127–135. - PMC - PubMed
    1. Ashburner M, Ball CA, Blake JA, Botstein D, Butler H, Cherry JM, Davis AP, Dolinski K, Dwight SS, Eppig JT, et al. Gene ontology: tool for the unification of biology. The Gene Ontology Consortium. Nat Genet. 2000;25:25–29. - PMC - PubMed
    1. Bosada FM, Devasthali V, Jones KA, Stankunas K. Wnt/beta-catenin signaling enables developmental transitions during valvulogenesis. Development 2016 - PMC - PubMed
    1. Carroll TJ, Park JS, Hayashi S, Majumdar A, McMahon AP. Wnt9b plays a central role in the regulation of mesenchymal to epithelial transitions underlying organogenesis of the mammalian urogenital system. Dev Cell. 2005;9:283–292. - PubMed
    1. Chang CP, Neilson JR, Bayle JH, Gestwicki JE, Kuo A, Stankunas K, Graef IA, Crabtree GR. A field of myocardial-endocardial NFAT signaling underlies heart valve morphogenesis. Cell. 2004;118:649–663. - PubMed

MeSH terms