BioPlex Display: An Interactive Suite for Large-Scale AP-MS Protein-Protein Interaction Data
- PMID: 29054129
- PMCID: PMC7029486
- DOI: 10.1021/acs.jproteome.7b00572
BioPlex Display: An Interactive Suite for Large-Scale AP-MS Protein-Protein Interaction Data
Abstract
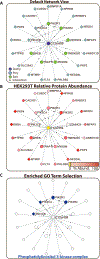
The development of large-scale data sets requires a new means to display and disseminate research studies to large audiences. Knowledge of protein-protein interaction (PPI) networks has become a principle interest of many groups within the field of proteomics. At the confluence of technologies, such as cross-linking mass spectrometry, yeast two-hybrid, protein cofractionation, and affinity purification mass spectrometry (AP-MS), detection of PPIs can uncover novel biological inferences at a high-throughput. Thus new platforms to provide community access to large data sets are necessary. To this end, we have developed a web application that enables exploration and dissemination of the growing BioPlex interaction network. BioPlex is a large-scale interactome data set based on AP-MS of baits from the human ORFeome. The latest BioPlex data set release (BioPlex 2.0) contains 56 553 interactions from 5891 AP-MS experiments. To improve community access to this vast compendium of interactions, we developed BioPlex Display, which integrates individual protein querying, access to empirical data, and on-the-fly annotation of networks within an easy-to-use and mobile web application. BioPlex Display enables rapid acquisition of data from BioPlex and development of hypotheses based on protein interactions.
Keywords: AP−MS; BioPlex; PHP/MySQL; data visualization; graph display; network communities; protein complexes; protein interactions; term enrichment; web application.
Conflict of interest statement
The authors declare the following competing financial interest(s): S.P.G is a consultant for Biogen, Inc.
Figures


Similar articles
-
Computational detection of protein complexes in AP-MS experiments.Proteomics. 2012 May;12(10):1663-8. doi: 10.1002/pmic.201100508. Proteomics. 2012. PMID: 22711593 Review.
-
Computational framework for analysis of prey-prey associations in interaction proteomics identifies novel human protein-protein interactions and networks.J Proteome Res. 2012 Sep 7;11(9):4476-87. doi: 10.1021/pr300227y. Epub 2012 Aug 21. J Proteome Res. 2012. PMID: 22845868 Free PMC article.
-
Dual proteome-scale networks reveal cell-specific remodeling of the human interactome.Cell. 2021 May 27;184(11):3022-3040.e28. doi: 10.1016/j.cell.2021.04.011. Epub 2021 May 6. Cell. 2021. PMID: 33961781 Free PMC article.
-
Reinforce: An Ensemble Approach for Inferring PPI Network from AP-MS Data.IEEE/ACM Trans Comput Biol Bioinform. 2019 Mar-Apr;16(2):365-376. doi: 10.1109/TCBB.2017.2705060. Epub 2017 May 17. IEEE/ACM Trans Comput Biol Bioinform. 2019. PMID: 28534782
-
Computational and informatics strategies for identification of specific protein interaction partners in affinity purification mass spectrometry experiments.Proteomics. 2012 May;12(10):1639-55. doi: 10.1002/pmic.201100537. Proteomics. 2012. PMID: 22611043 Free PMC article. Review.
Cited by
-
DNA O-MAP uncovers the molecular neighborhoods associated with specific genomic loci.bioRxiv [Preprint]. 2024 Jul 29:2024.07.24.604987. doi: 10.1101/2024.07.24.604987. bioRxiv. 2024. PMID: 39091817 Free PMC article. Preprint.
-
Mitoproteomics: Tackling Mitochondrial Dysfunction in Human Disease.Oxid Med Cell Longev. 2018 Nov 8;2018:1435934. doi: 10.1155/2018/1435934. eCollection 2018. Oxid Med Cell Longev. 2018. PMID: 30533169 Free PMC article. Review.
-
Guanosine triphosphate links MYC-dependent metabolic and ribosome programs in small-cell lung cancer.J Clin Invest. 2021 Jan 4;131(1):e139929. doi: 10.1172/JCI139929. J Clin Invest. 2021. PMID: 33079728 Free PMC article.
-
Heat shock protein Hspa13 regulates endoplasmic reticulum and cytosolic proteostasis through modulation of protein translocation.J Biol Chem. 2022 Dec;298(12):102597. doi: 10.1016/j.jbc.2022.102597. Epub 2022 Oct 14. J Biol Chem. 2022. PMID: 36244454 Free PMC article.
-
The Rogdi knockout mouse is a model for Kohlschütter-Tönz syndrome.Sci Rep. 2024 Jan 3;14(1):445. doi: 10.1038/s41598-023-50870-2. Sci Rep. 2024. PMID: 38172607 Free PMC article.
References
Publication types
MeSH terms
Grants and funding
LinkOut - more resources
Full Text Sources
Other Literature Sources
Molecular Biology Databases

