

Innate Sensing of Influenza A Virus Hemagglutinin Glycoproteins by the Host Endoplasmic Reticulum (ER) Stress Pathway Triggers a Potent Antiviral Response via ER-Associated Protein Degradation
- PMID: 29046440
- PMCID: PMC5730784
- DOI: 10.1128/JVI.01690-17
Innate Sensing of Influenza A Virus Hemagglutinin Glycoproteins by the Host Endoplasmic Reticulum (ER) Stress Pathway Triggers a Potent Antiviral Response via ER-Associated Protein Degradation
Abstract
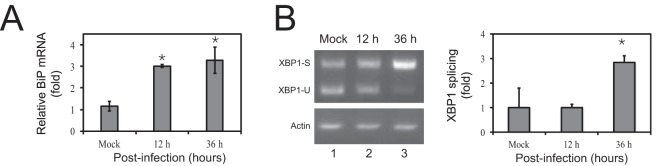
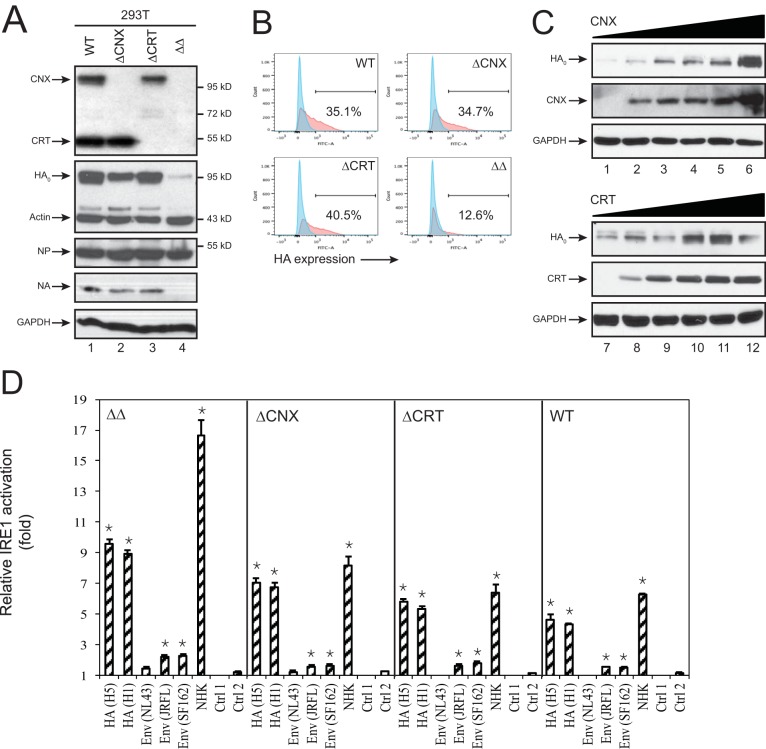
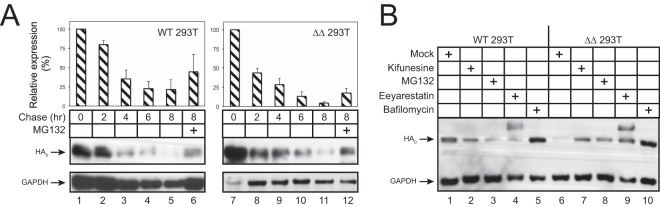
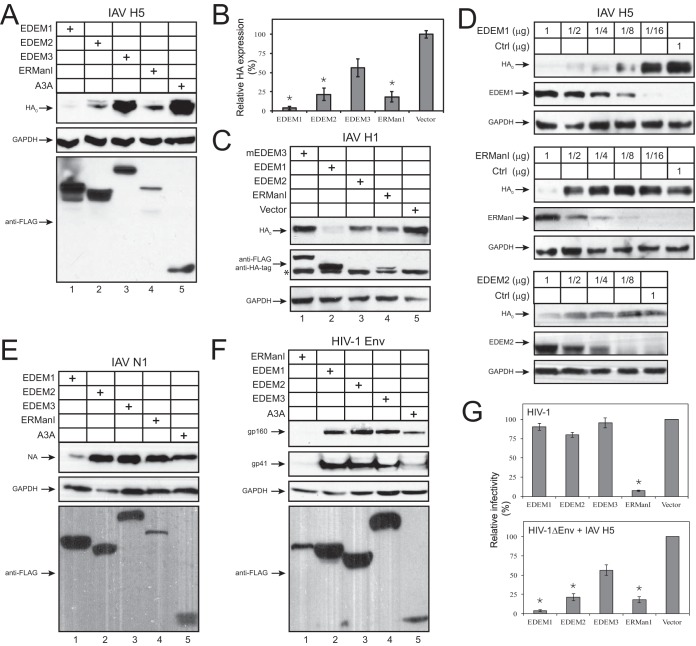
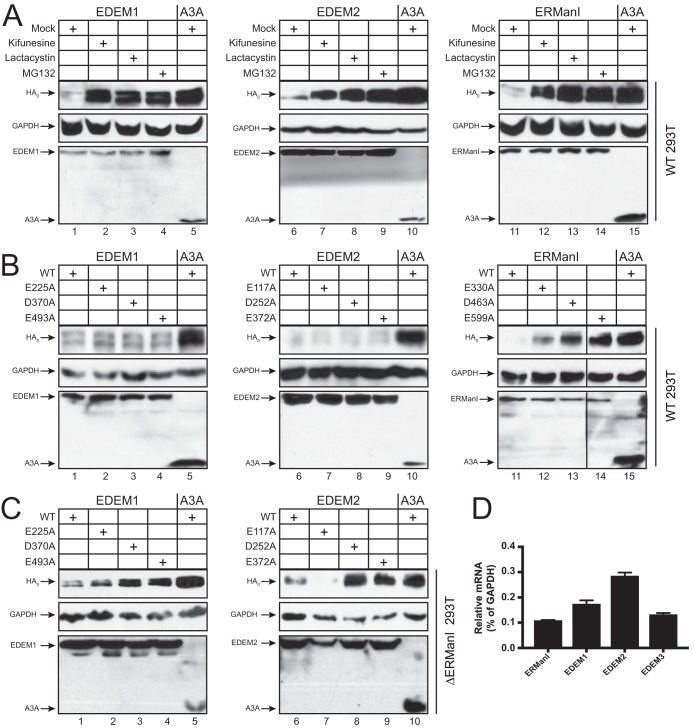
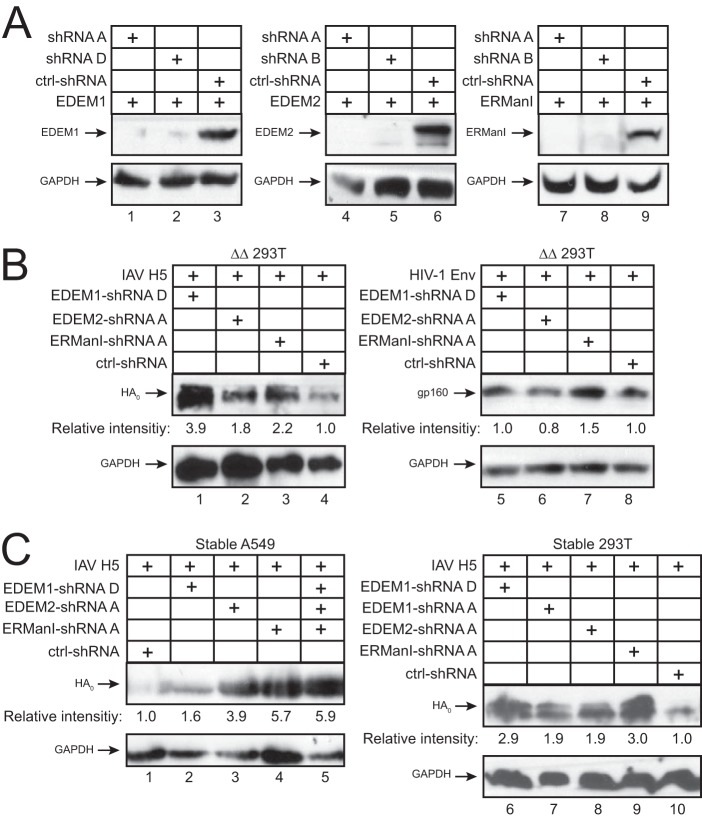
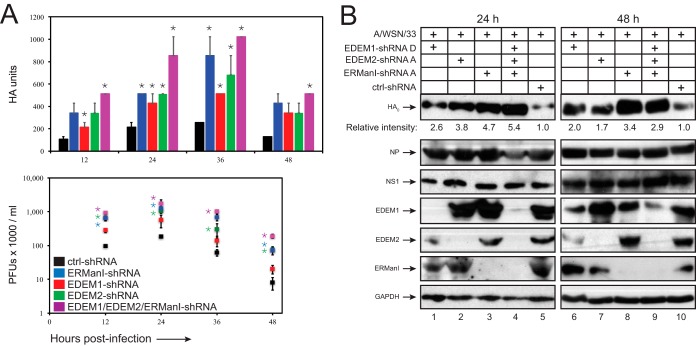
Innate immunity provides an immediate defense against infection after host cells sense danger signals from microbes. Endoplasmic reticulum (ER) stress arises from accumulation of misfolded/unfolded proteins when protein load overwhelms the ER folding capacity, which activates the unfolded protein response (UPR) to restore ER homeostasis. Here, we show that a mechanism for antiviral innate immunity is triggered after the ER stress pathway senses viral glycoproteins. When hemagglutinin (HA) glycoproteins from influenza A virus (IAV) are expressed in cells, ER stress is induced, resulting in rapid HA degradation via proteasomes. The ER-associated protein degradation (ERAD) pathway, an important UPR function for destruction of aberrant proteins, mediates HA degradation. Three class I α-mannosidases were identified to play a critical role in the degradation process, including EDEM1, EDEM2, and ERManI. HA degradation requires either ERManI enzymatic activity or EDEM1/EDEM2 enzymatic activity when ERManI is not expressed, indicating that demannosylation is a critical step for HA degradation. Silencing of EDEM1, EDEM2, and ERManI strongly increases HA expression and promotes IAV replication. Thus, the ER stress pathway senses influenza HA as "nonself" or misfolded protein and sorts HA to ERAD for degradation, resulting in inhibition of IAV replication.IMPORTANCE Viral nucleic acids are recognized as important inducers of innate antiviral immune responses that are sensed by multiple classes of sensors, but other inducers and sensors of viral innate immunity need to be identified and characterized. Here, we used IAV to investigate how host innate immunity is activated. We found that IAV HA glycoproteins induce ER stress, resulting in HA degradation via ERAD and consequent inhibition of IAV replication. In addition, we have identified three class I α-mannosidases, EDEM1, EDEM2, and ERManI, which play a critical role in initiating HA degradation. Knockdown of these proteins substantially increases HA expression and IAV replication. The enzymatic activities and joint actions of these mannosidases are required for this antiviral activity. Our results suggest that viral glycoproteins induce a strong innate antiviral response through activating the ER stress pathway during viral infection.
Keywords: EDEM1; EDEM2; EDEM3; ER stress; ERAD; ERManI; HA; NA; PAMP; PRR; UPR; hemagglutinin; influenza; innate immunity.
Copyright © 2017 American Society for Microbiology.
Figures
Similar articles
-
ERManI (Endoplasmic Reticulum Class I α-Mannosidase) Is Required for HIV-1 Envelope Glycoprotein Degradation via Endoplasmic Reticulum-associated Protein Degradation Pathway.J Biol Chem. 2015 Sep 4;290(36):22184-92. doi: 10.1074/jbc.M115.675207. Epub 2015 Jul 23. J Biol Chem. 2015. PMID: 26205822 Free PMC article.
-
Hemagglutinin of Influenza A Virus Antagonizes Type I Interferon (IFN) Responses by Inducing Degradation of Type I IFN Receptor 1.J Virol. 2015 Dec 16;90(5):2403-17. doi: 10.1128/JVI.02749-15. J Virol. 2015. PMID: 26676772 Free PMC article.
-
Activation of ERAD pathway by human hepatitis B virus modulates viral and subviral particle production.PLoS One. 2012;7(3):e34169. doi: 10.1371/journal.pone.0034169. Epub 2012 Mar 26. PLoS One. 2012. PMID: 22461906 Free PMC article.
-
Glycoprotein folding and the role of EDEM1, EDEM2 and EDEM3 in degradation of folding-defective glycoproteins.FEBS Lett. 2007 Jul 31;581(19):3658-64. doi: 10.1016/j.febslet.2007.04.070. Epub 2007 May 4. FEBS Lett. 2007. PMID: 17499246 Review.
-
The Role of Lectin-Carbohydrate Interactions in the Regulation of ER-Associated Protein Degradation.Molecules. 2015 May 27;20(6):9816-46. doi: 10.3390/molecules20069816. Molecules. 2015. PMID: 26023941 Free PMC article. Review.
Cited by
-
The roles of apoptosis, autophagy and unfolded protein response in arbovirus, influenza virus, and HIV infections.Virulence. 2019 Dec;10(1):376-413. doi: 10.1080/21505594.2019.1605803. Virulence. 2019. PMID: 30966844 Free PMC article. Review.
-
Influenza-mediated reduction of lung epithelial ion channel activity leads to dysregulated pulmonary fluid homeostasis.JCI Insight. 2018 Oct 18;3(20):e123467. doi: 10.1172/jci.insight.123467. JCI Insight. 2018. PMID: 30333319 Free PMC article.
-
Influenza A virus propagation requires the activation of the unfolded protein response and the accumulation of insoluble protein aggregates.iScience. 2024 Feb 2;27(3):109100. doi: 10.1016/j.isci.2024.109100. eCollection 2024 Mar 15. iScience. 2024. PMID: 38405606 Free PMC article.
-
Molecular Events Involved in Influenza A Virus-Induced Cell Death.Front Microbiol. 2022 Jan 7;12:797789. doi: 10.3389/fmicb.2021.797789. eCollection 2021. Front Microbiol. 2022. PMID: 35069499 Free PMC article. Review.
-
Thiopurines activate an antiviral unfolded protein response that blocks influenza A virus glycoprotein accumulation.J Virol. 2021 May 10;95(11):e00453-21. doi: 10.1128/JVI.00453-21. Epub 2021 Mar 24. J Virol. 2021. PMID: 33762409 Free PMC article.
References
Publication types
MeSH terms
Substances
Grants and funding
LinkOut - more resources
Full Text Sources
Other Literature Sources
