

Respiratory Syncytial Virus Genotypes, Host Immune Profiles, and Disease Severity in Young Children Hospitalized With Bronchiolitis
- PMID: 29045741
- PMCID: PMC5853407
- DOI: 10.1093/infdis/jix543
Respiratory Syncytial Virus Genotypes, Host Immune Profiles, and Disease Severity in Young Children Hospitalized With Bronchiolitis
Abstract
Background: Data on how respiratory syncytial virus (RSV) genotypes influence disease severity and host immune responses is limited. Here, we characterized the genetic variability of RSV during 5 seasons, and evaluated the role of RSV subtypes, genotypes, and viral loads in disease severity and host transcriptional profiles.
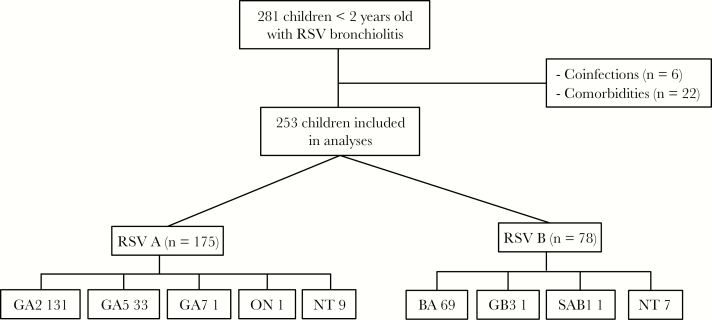
Methods: A prospective, observational study was carried out, including a convenience sample of healthy infants hospitalized with RSV bronchiolitis. Nasopharyngeal samples for viral load quantitation, typing, and genotyping, and blood samples for transcriptome analyses were obtained within 24 hours of hospitalization. Multivariate models were constructed to identify virologic and clinical variables predictive of clinical outcomes.
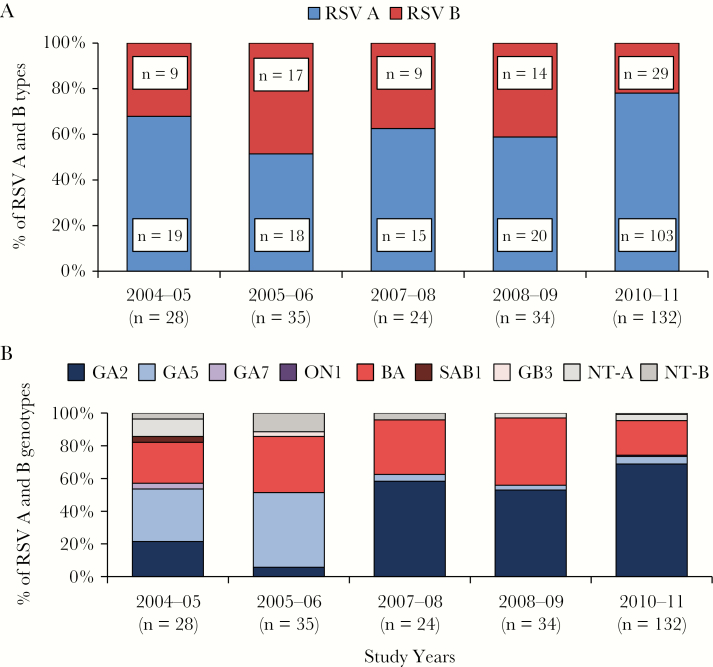
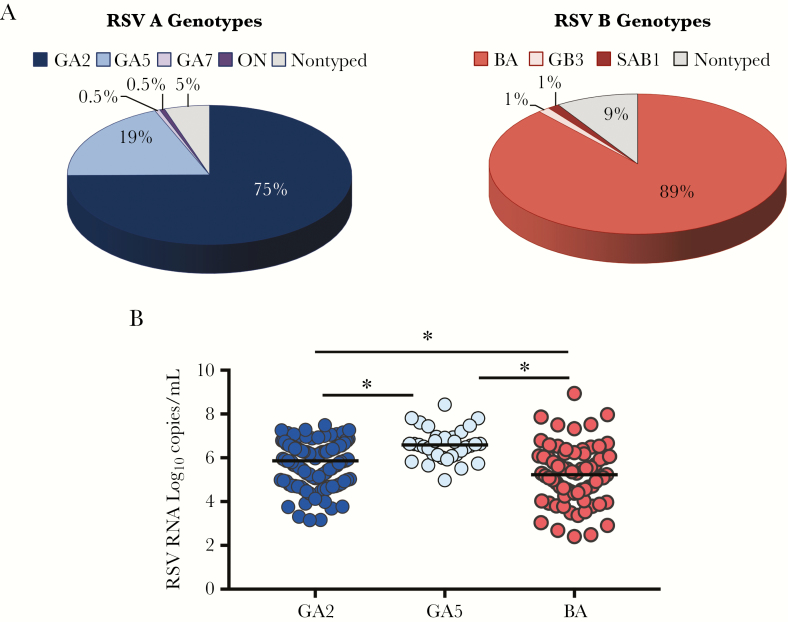
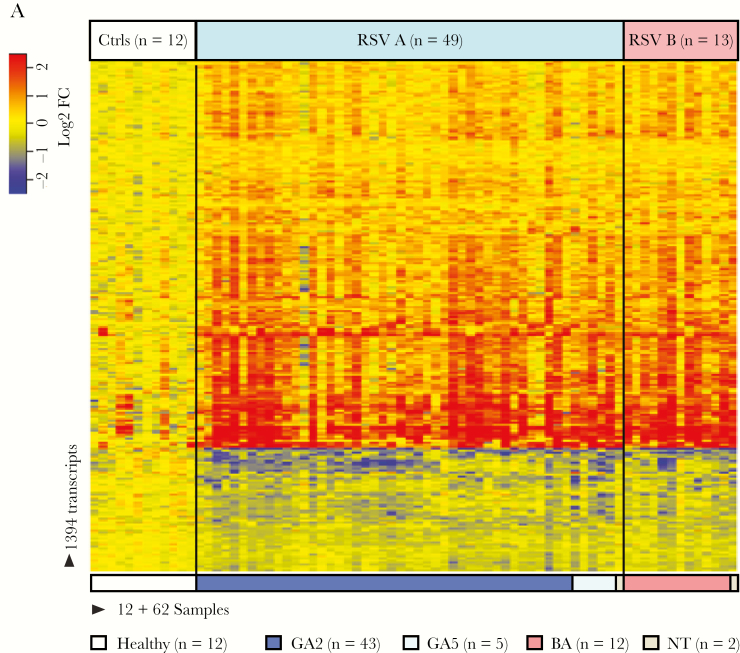
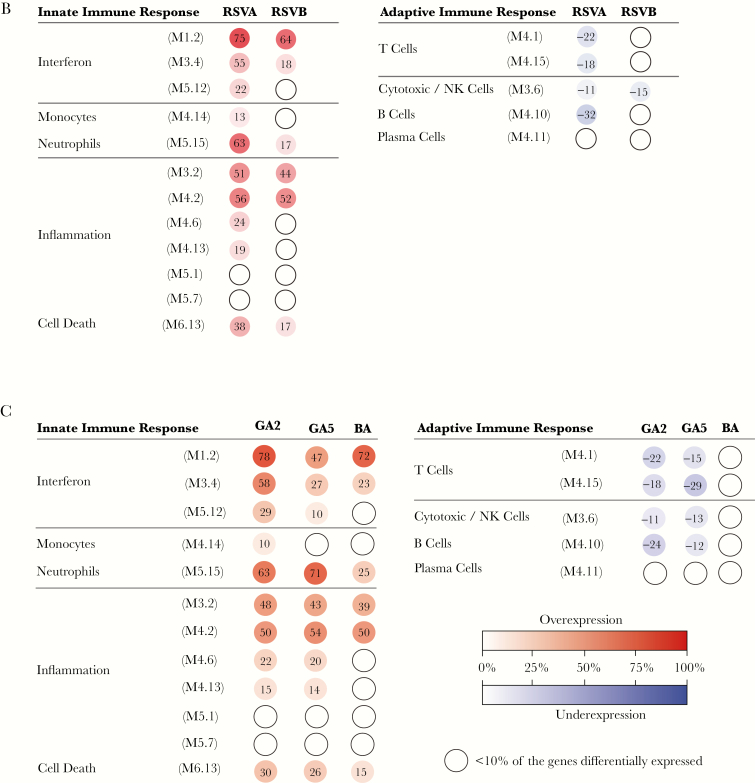
Results: We enrolled 253 infants (median age 2.1 [25%-75% interquartile range] months). RSV A infections predominated over RSV B and showed greater genotype variability. RSV A/GA2, A/GA5, and RSV B/BA were the most common genotypes identified. Compared to GA2 or BA, infants with GA5 infections had higher viral loads. GA5 infections were associated with longer hospital stay, and with less activation of interferon and increased overexpression of neutrophil genes.
Conclusions: RSV A infections were more frequent than RSV B, and displayed greater variability. GA5 infections were associated with enhanced disease severity and distinct host immune responses.
Keywords: bronchiolitis; genomic loads; host responses.
© The Author 2017. Published by Oxford University Press for the Infectious Diseases Society of America. All rights reserved. For permissions, e-mail: journals.permissions@oup.com.
Figures
Similar articles
-
How Respiratory Syncytial Virus Genotypes Influence the Clinical Course in Infants Hospitalized for Bronchiolitis.J Infect Dis. 2019 Jan 29;219(4):526-534. doi: 10.1093/infdis/jiy496. J Infect Dis. 2019. PMID: 30204889
-
Evaluation of viral load in infants hospitalized with bronchiolitis caused by respiratory syncytial virus.Med Microbiol Immunol. 2012 Aug;201(3):311-7. doi: 10.1007/s00430-012-0233-6. Epub 2012 Mar 10. Med Microbiol Immunol. 2012. PMID: 22406873 Free PMC article.
-
Genomic Loads and Genotypes of Respiratory Syncytial Virus: Viral Factors during Lower Respiratory Tract Infection in Chilean Hospitalized Infants.Int J Mol Sci. 2017 Mar 21;18(3):654. doi: 10.3390/ijms18030654. Int J Mol Sci. 2017. PMID: 28335547 Free PMC article.
-
The Contribution of Neutrophils to the Pathogenesis of RSV Bronchiolitis.Viruses. 2020 Jul 27;12(8):808. doi: 10.3390/v12080808. Viruses. 2020. PMID: 32726921 Free PMC article. Review.
-
Immunological mechanisms of severe respiratory syncytial virus bronchiolitis.Intensive Care Med. 2002 May;28(5):616-21. doi: 10.1007/s00134-002-1256-z. Epub 2002 Mar 26. Intensive Care Med. 2002. PMID: 12029411 Review.
Cited by
-
Evolution of Human Respiratory Syncytial Virus (RSV) over Multiple Seasons in New South Wales, Australia.Viruses. 2018 Sep 6;10(9):476. doi: 10.3390/v10090476. Viruses. 2018. PMID: 30200580 Free PMC article.
-
Genotyping of respiratory syncytial virus among influenza-like illness and severe acute respiratory infection cases of children in the Philippines from 2006 to 2016.Influenza Other Respir Viruses. 2022 Sep;16(5):942-951. doi: 10.1111/irv.12986. Epub 2022 May 18. Influenza Other Respir Viruses. 2022. PMID: 35582932 Free PMC article.
-
Increased Heme Oxygenase 1 Expression upon a Primary Exposure to the Respiratory Syncytial Virus and a Secondary Mycobacterium bovis Infection.Antioxidants (Basel). 2022 Jul 26;11(8):1453. doi: 10.3390/antiox11081453. Antioxidants (Basel). 2022. PMID: 35892656 Free PMC article.
-
Delayed respiratory syncytial virus outbreak in 2020 in Taiwan was correlated with two novel RSV-A genotype ON1 variants.Influenza Other Respir Viruses. 2022 May;16(3):511-520. doi: 10.1111/irv.12951. Epub 2021 Dec 16. Influenza Other Respir Viruses. 2022. PMID: 34913593 Free PMC article.
-
Seasonality, Clinical Characteristics, and Outcomes of Respiratory Syncytial Virus Disease by Subtype Among Children Aged <5 Years: New Vaccine Surveillance Network, United States, 2016-2020.Clin Infect Dis. 2024 May 15;78(5):1352-1359. doi: 10.1093/cid/ciae085. Clin Infect Dis. 2024. PMID: 38366649 Free PMC article.
References
-
- Leader S, Kohlhase K. Respiratory syncytial virus-coded pediatric hospitalizations, 1997 to 1999. Pediatr Infect Dis J 2002; 21:629–32. - PubMed
-
- McConnochie KM, Hall CB, Walsh EE, Roghmann KJ. Variation in severity of respiratory syncytial virus infections with subtype. J Pediatr 1990; 117:52–62. - PubMed
-
- Imaz MS, Sequeira MD, Videla C et al. . Clinical and epidemiologic characteristics of respiratory syncytial virus subgroups A and B infections in Santa Fe, Argentina. J Med Virol 2000; 61:76–80. - PubMed
-
- Walsh EE, McConnochie KM, Long CE, Hall CB. Severity of respiratory syncytial virus infection is related to virus strain. J Infect Dis 1997; 175:814–20. - PubMed
-
- Jafri HS, Wu X, Makari D, Henrickson KJ. Distribution of respiratory syncytial virus subtypes A and B among infants presenting to the emergency department with lower respiratory tract infection or apnea. Pediatr Infect Dis J 2013; 32:335–40. - PubMed
Publication types
MeSH terms
Substances
Grants and funding
LinkOut - more resources
Full Text Sources
Other Literature Sources
Medical
Molecular Biology Databases
