. 2017 Nov 1;127(11):4179-4192.
doi: 10.1172/JCI91258. Epub 2017 Oct 16.

MNK1/2 inhibition limits oncogenicity and metastasis of KIT-mutant melanoma

Affiliations

MNK1/2 inhibition limits oncogenicity and metastasis of KIT-mutant melanoma

Yao Zhan et al. J Clin Invest. .

Erratum in

  • MNK1/2 inhibition limits oncogenicity and metastasis of KIT-mutant melanoma.
    Zhan Y, Guo J, Yang W, Goncalves C, Rzymski T, Dreas A, Żyłkiewicz E, Mikulski M, Brzózka K, Golas A, Kong Y, Ma M, Huang F, Huor B, Guo Q, da Silva SD, Torres J, Cai Y, Topisirovic I, Su J, Bijian K, Alaoui-Jamali MA, Huang S, Journe F, Ghanem GE, Miller WH Jr, Del Rincón SV. Zhan Y, et al. J Clin Invest. 2024 Apr 15;134(8):e181338. doi: 10.1172/JCI181338. J Clin Invest. 2024. PMID: 38618965 Free PMC article. No abstract available.

Abstract

Melanoma can be stratified into unique subtypes based on distinct pathologies. The acral/mucosal melanoma subtype is characterized by aberrant and constitutive activation of the proto-oncogene receptor tyrosine kinase C-KIT, which drives tumorigenesis. Treatment of these melanoma patients with C-KIT inhibitors has proven challenging, prompting us to investigate the downstream effectors of the C-KIT receptor. We determined that C-KIT stimulates MAP kinase-interacting serine/threonine kinases 1 and 2 (MNK1/2), which phosphorylate eukaryotic translation initiation factor 4E (eIF4E) and render it oncogenic. Depletion of MNK1/2 in melanoma cells with oncogenic C-KIT inhibited cell migration and mRNA translation of the transcriptional repressor SNAI1 and the cell cycle gene CCNE1. This suggested that blocking MNK1/2 activity may inhibit tumor progression, at least in part, by blocking translation initiation of mRNAs encoding cell migration proteins. Moreover, we developed an MNK1/2 inhibitor (SEL201), and found that SEL201-treated KIT-mutant melanoma cells had lower oncogenicity and reduced metastatic ability. Clinically, tumors from melanoma patients harboring KIT mutations displayed a marked increase in MNK1 and phospho-eIF4E. Thus, our studies indicate that blocking MNK1/2 exerts potent antimelanoma effects and support blocking MNK1/2 as a potential strategy to treat patients positive for KIT mutations.


Conflict of interest statement

Conflict of interest: A. Dreas, E. Żyłkiewicz, T. Rzymski, K. Brzózka, and A. Golas are employees of Selvita S.A.

Figures

Figure 1
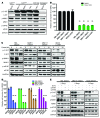
Figure 1. C-KIT inhibitor dasatinib suppresses cell proliferation and the activation of the MNK/eIF4E axis in KIT-mutant melanomas.
(A) Western blot analysis of phospho-MNK1 (p-MNK1), MNK1, phospho-eIF4E (p-eIF4E), and eIF4E in a panel of melanoma cell lines. (B) Cell proliferation was assessed by SRB staining, 72 hours after vehicle (DMSO) or 10 nM dasatinib treatment in HBL, MM61, MM111, and M230 melanoma cell lines. (C) Western blot analysis of phospho–C-KIT (p-C-KIT), C-KIT, p-eIF4E, eIF4E, p-MNK1, and MNK1 in HBL, MM111, MM61, and M230 melanoma cell lines, following a 24-hour dasatinib treatment. (D) Cell proliferation was assessed by SRB staining, 96 hours after transfection with KIT siRNAs. (E) Western blot analysis of p-C-KIT, C-KIT, p-eIF4E, eIF4E, p-MNK1, and MNK1 in HBL, MM111, and M230 cell lines transfected with KIT siRNAs, at the indicated time points. (B and D) Data represent the mean ± SD, n = 3. **P < 0.01 by 2-way ANOVA. (A, C, and E) GAPDH used as loading control.
Figure 2
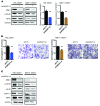
Figure 2. MNK1/2 knockdown in HBL cells suppresses cell migration and the expression of cyclin E1 and SNAIL.
(A) Western blot analysis of MNK1, p-eIF4E, and eIF4E in HBL or MM111 cells expressing shCTL and shMKNK1+2 (left). RT-qPCR was performed to examine the expression level of MKNK2 mRNA in HBL and MM111 cells expressing shCTL and shMKNK1+2 (right). (B) Cell migration was assessed by Transwell assay in shCTL versus shMKNK1+2 HBL and MM111 cells after 48 hours. Representative images are shown. Scale bars: 200 μm; original magnification, ×10. (A and B) Data represent the mean ± SD, n = 3. **P < 0.01 by 2-tailed Student’s t test. (C) Western blot analysis of MNK1, p-eIF4E, eIF4E, cyclin E1, and SNAIL in HBL and MM111 shCTL and shMKNK1+2 cell lines. (A and C) GAPDH is used as loading control.
Figure 3
Figure 3. Inhibition of MNK1/2 impairs CCNE1 and SNAI1 mRNA translation in KIT-mutant melanoma cells.
(A) Absorbance profiles (254 nm) of sucrose gradients loaded with HBL shCTL (black) and shMKNK1+2 (red) cytosolic extracts. (B) RT-qPCR was performed to monitor SNAI1 and CCNE1 mRNA in HBL shCTL and shMKNK1+2 cell lines. Data represent the mean ± SD, n = 3. P > 0.05 by 2-tailed Student’s t test. (C) RT-qPCR was performed to determine the distribution of ACTB, SNAI1, and CCNE1 mRNAs in light versus heavy polysome fractions obtained from the sucrose gradient described in A. Data represent the mean ± SD, n = 3. *P < 0.05, **P < 0.01 by 2-tailed Student’s t test.
Figure 4
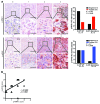
Figure 4. KIT-mutant melanoma patients express high phospho-MNK1 and phospho-eIF4E.
(A) Representative images of p-MNK1 and p-eIF4E IHC staining. Bar graphs of p-MNK1 and p-eIF4E IHC scores in melanoma patients are shown in the right panel. χ2 test, P values shown in the figure. For p-MNK1 and p-eIF4E top panels, scale bars: 200 μm; original magnification, ×4. For p-MNK1 and p-eIF4E bottom panels, scale bars: 40 μm; original magnification: ×20. (B) The correlation between p-eIF4E and p-MNK1 IHC scores in melanoma patients. Pearson correlation test, r and P values are shown.
Figure 5
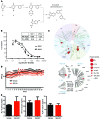
Figure 5. Chemical synthesis, in vitro kinome selectivity, and biosafety of SEL201.
(A) Chemical synthesis procedure of SEL201. (B) The in vitro ADP-Glo assay was performed by incubation of SEL201 with recombinant MNK1 and MNK2, peptide substrates, and ATP. After the kinase reaction, luminescence intensity generated by the remaining ADP was measured. (C) Kinome selectivity of SEL201 was assessed using KINOMEscan (DiscoverX) panel, which consists of 450 kinases. Circles represent targets that interacted with SEL201 at the concentration of 1 μM. (D) Body weight kinetics of tumor-bearing mice (6 animals per group) was assessed throughout the study (endpoint on day 37). Vehicle or SEL201 was administered p.o. to animals at the dosage of 50 mg/kg twice daily (100 mg/kg/d; mean ± SD). (E) Assessment of blood biochemistry in mice (3 animals per group) given SEL201 at the dosage of 50 mg/kg twice daily (100 mg/kg/d) was performed at the study endpoint (day 37). AST, aspartate aminotransferase; ALT, alanine transaminase; ALP, alkaline phosphatase.
Figure 6
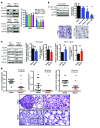
Figure 6. MNK1/2 inhibitor SEL201 suppresses clonogenicity, cell migration, and in vivo tumor metastasis.
(A) Graph of 14-day clonogenic assay: HBL, MM61, MM111, and M230 cell lines were treated with or without 5 μM SEL201 (right). Data represent the mean ± SD, n = 3. **P < 0.01 by 2-way ANOVA. Western blot analysis of p-eIF4E and eIF4E; HBL, MM61, MM111, and M230 cell lines were treated with 5 μM SEL201 for 24 hours (left). (B) Western blot analysis of p-eIF4E and eIF4E in HBL cells following SEL201 treatment (48 hours). Cell migration was assessed by Transwell assay. Representative images are shown. Scale bars: 200 μm; original magnification, ×10. Data represent the mean ± SD, n = 3. **P < 0.01 by 1-way ANOVA. (C) HBL and MM111 cell lines were treated with 5 μM SEL201 for 24 hours (left). Western blot analysis of p-eIF4E, eIF4E, cyclin E1, and SNAIL. HBL and MM111 cell lines were treated with 5 μM SEL201 for 24 hours (right). RT-qPCR analysis for SNAI1 and CCNE1 mRNA expression. Data represent the mean ± SD, n = 3. P > 0.05 by 2-tailed Student’s t test. (D) 8 × 10⁶ MM111 cells were injected in the tail vein of NOD/SCID mice. Tumor burden was defined as the percentage of lung area occupied by tumor cells. Representative images are shown. For the left panel, scale bars: 300 μm. For the right panel, scale bars: 50 μm. Data represent the mean ± SD, n = 10. *P < 0.05, **P < 0.01 by 2-way ANOVA. (AC) GAPDH is used as a loading control.
Figure 7
Figure 7. Schematic diagram of the MNK/eIF4E axis in KIT-mutant acral or mucosal melanoma.

Similar articles

Cited by

References

    1. Forman SB, et al. Is superficial spreading melanoma still the most common form of malignant melanoma? J Am Acad Dermatol. 2008;58(6):1013–1020. doi: 10.1016/j.jaad.2007.10.650. - DOI - PubMed
    1. Chan KK, Chan RC, Ho RS, Chan JY. Clinical patterns of melanoma in Asians: 11-year experience in a tertiary referral center. Ann Plast Surg. 2016;77(suppl 1):S6–S11. - PubMed
    1. Kong Y, et al. Large-scale analysis of KIT aberrations in Chinese patients with melanoma. Clin Cancer Res. 2011;17(7):1684–1691. doi: 10.1158/1078-0432.CCR-10-2346. - DOI - PubMed
    1. Curtin JA, Busam K, Pinkel D, Bastian BC. Somatic activation of KIT in distinct subtypes of melanoma. J Clin Oncol. 2006;24(26):4340–4346. doi: 10.1200/JCO.2006.06.2984. - DOI - PubMed
    1. Carvajal RD, et al. KIT as a therapeutic target in metastatic melanoma. JAMA. 2011;305(22):2327–2334. doi: 10.1001/jama.2011.746. - DOI - PMC - PubMed

MeSH terms

Grants and funding

This study also received travel grants from Québec/Wallonie-Bruxelles International for scientific exchange between Jewish General Hospital, McGill University and Institut Jules Bordet, Université Libre de Bruxelles.