

Laminar and Cellular Distribution of Monoamine Receptors in Rat Medial Prefrontal Cortex
- PMID: 29033796
- PMCID: PMC5625028
- DOI: 10.3389/fnana.2017.00087
Laminar and Cellular Distribution of Monoamine Receptors in Rat Medial Prefrontal Cortex
Abstract
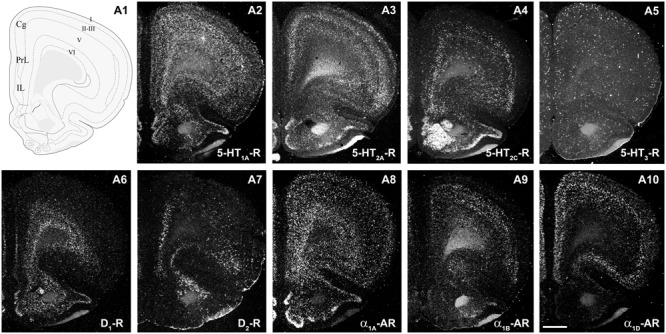
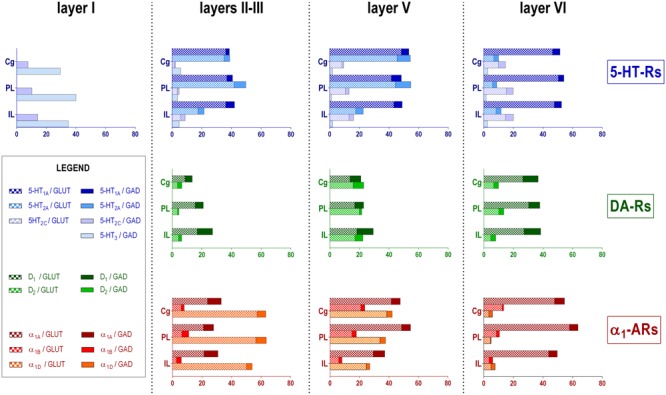
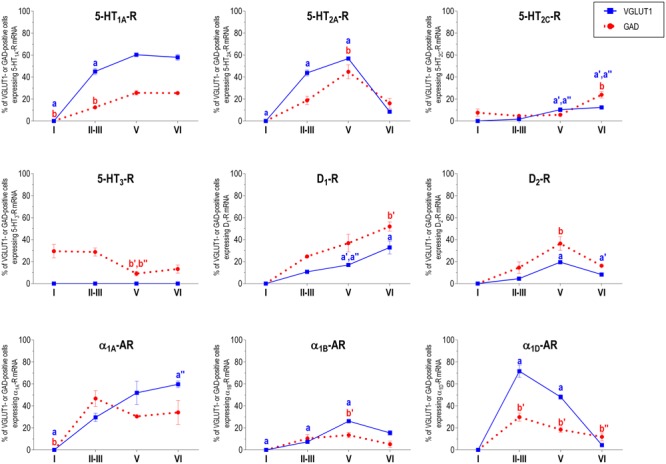
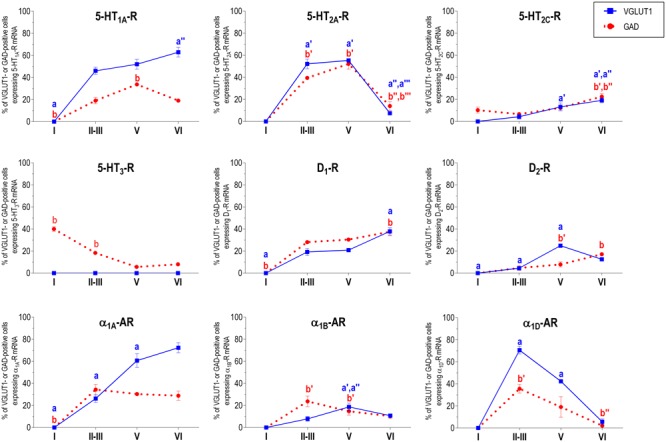
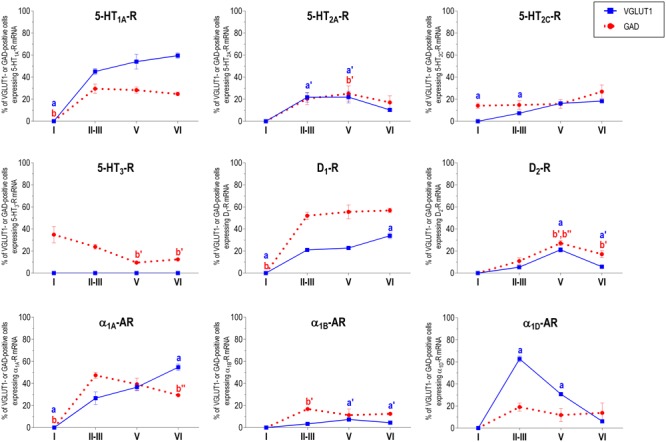
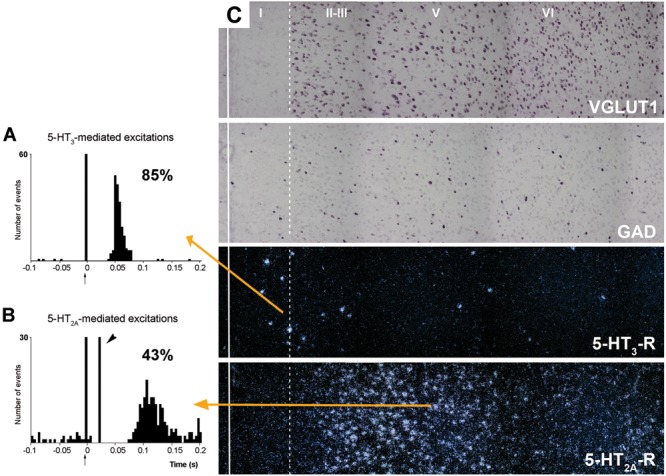
The prefrontal cortex (PFC) is deeply involved in higher brain functions, many of which are altered in psychiatric conditions. The PFC exerts a top-down control of most cortical and subcortical areas through descending pathways and is densely innervated by axons emerging from the brainstem monoamine cell groups, namely, the dorsal and median raphe nuclei (DR and MnR, respectively), the ventral tegmental area and the locus coeruleus (LC). In turn, the activity of these cell groups is tightly controlled by afferent pathways arising from layer V PFC pyramidal neurons. The reciprocal connectivity between PFC and monoamine cell groups is of interest to study the pathophysiology and treatment of severe psychiatric disorders, such as major depression and schizophrenia, inasmuch as antidepressant and antipsychotic drugs target monoamine receptors/transporters expressed in these areas. Here we review previous reports examining the presence of monoamine receptors in pyramidal and GABAergic neurons of the PFC using double in situ hybridization. Additionally, we present new data on the quantitative layer distribution (layers I, II-III, V, and VI) of monoamine receptor-expressing cells in the cingulate (Cg), prelimbic (PrL) and infralimbic (IL) subfields of the medial PFC (mPFC). The receptors examined include serotonin 5-HT1A, 5-HT2A, 5-HT2C, and 5-HT3, dopamine D1 and D2 receptors, and α1A-, α1B-, and α1D-adrenoceptors. With the exception of 5-HT3 receptors, selectively expressed by layers I-III GABA interneurons, the rest of monoamine receptors are widely expressed by pyramidal and GABAergic neurons in intermediate and deep layers of mPFC (5-HT2C receptors are also expressed in layer I). This complex distribution suggests that monoamines may modulate the communications between PFC and cortical/subcortical areas through the activation of receptors expressed by neurons in intermediate (e.g., 5-HT1A, 5-HT2A, α1D-adrenoceptors, dopamine D1 receptors) and deep layers (e.g., 5-HT1A, 5-HT2A, α1A-adrenoceptors, dopamine D2 receptors), respectively. Overall, these data provide a detailed framework to better understand the role of monoamines in the processing of cognitive and emotional signals by the PFC. Likewise, they may be helpful to characterize brain circuits relevant for the therapeutic action of antidepressant and antipsychotic drugs and to improve their therapeutic action, overcoming the limitations of current drugs.
Keywords: 5-hydroxytryptamine (serotonin) receptors; antidepressant drugs; antipsychotic drugs; cortical layers; dopamine receptors; major depressive disorder; noradrenaline receptors; schizophrenia.
Figures
Similar articles
-
Expression of Serotonin2C Receptors in Pyramidal and GABAergic Neurons of Rat Prefrontal Cortex: A Comparison with Striatum.Cereb Cortex. 2017 Jun 1;27(6):3125-3139. doi: 10.1093/cercor/bhw148. Cereb Cortex. 2017. PMID: 27252352
-
Expression of 5-HT2A receptors in prefrontal cortex pyramidal neurons projecting to nucleus accumbens. Potential relevance for atypical antipsychotic action.Neuropharmacology. 2014 Apr;79:49-58. doi: 10.1016/j.neuropharm.2013.10.021. Epub 2013 Nov 7. Neuropharmacology. 2014. PMID: 24211653
-
In vivo excitation of GABA interneurons in the medial prefrontal cortex through 5-HT3 receptors.Cereb Cortex. 2004 Dec;14(12):1365-75. doi: 10.1093/cercor/bhh097. Epub 2004 May 27. Cereb Cortex. 2004. PMID: 15166106
-
[Serotonergic control of prefrontal cortex].Rev Neurol. 2004 Sep 16-30;39(6):539-47. Rev Neurol. 2004. PMID: 15467993 Review. Spanish.
-
Cartography of 5-HT1A and 5-HT2A Receptor Subtypes in Prefrontal Cortex and Its Projections.ACS Chem Neurosci. 2015 Jul 15;6(7):1089-98. doi: 10.1021/acschemneuro.5b00023. Epub 2015 Mar 13. ACS Chem Neurosci. 2015. PMID: 25739427 Review.
Cited by
-
Withdrawal from chronic alcohol impairs the serotonin-mediated modulation of GABAergic transmission in the infralimbic cortex in male rats.Neurobiol Dis. 2024 Sep;199:106590. doi: 10.1016/j.nbd.2024.106590. Epub 2024 Jul 10. Neurobiol Dis. 2024. PMID: 38996987
-
Astrocyte β-Adrenergic Receptor Activity Regulates NMDA Receptor Signaling of Medial Prefrontal Cortex Pyramidal Neurons.J Neurosci. 2024 Jan 10;44(2):e0990232023. doi: 10.1523/JNEUROSCI.0990-23.2023. J Neurosci. 2024. PMID: 37989594 Free PMC article.
-
The ascending arousal system promotes optimal performance through mesoscale network integration in a visuospatial attentional task.Netw Neurosci. 2021 Nov 30;5(4):890-910. doi: 10.1162/netn_a_00205. eCollection 2021. Netw Neurosci. 2021. PMID: 35024535 Free PMC article.
-
Association of Serotonin2c Receptor Polymorphisms With Antipsychotic Drug Response in Schizophrenia.Front Psychiatry. 2019 Feb 15;10:58. doi: 10.3389/fpsyt.2019.00058. eCollection 2019. Front Psychiatry. 2019. PMID: 30828307 Free PMC article.
-
Prefrontal Contributions to Attention and Working Memory.Curr Top Behav Neurosci. 2019;41:129-153. doi: 10.1007/7854_2018_74. Curr Top Behav Neurosci. 2019. PMID: 30739308 Free PMC article. Review.
References
Publication types
LinkOut - more resources
Full Text Sources
Other Literature Sources
Miscellaneous