

Self-assembly of model proteins into virus capsids
- PMID: 29027904
- PMCID: PMC7104874
- DOI: 10.1088/1361-648X/aa9351
Self-assembly of model proteins into virus capsids
Abstract
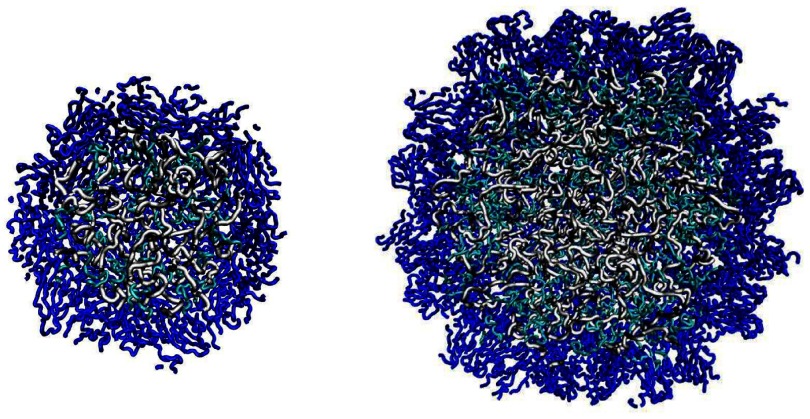
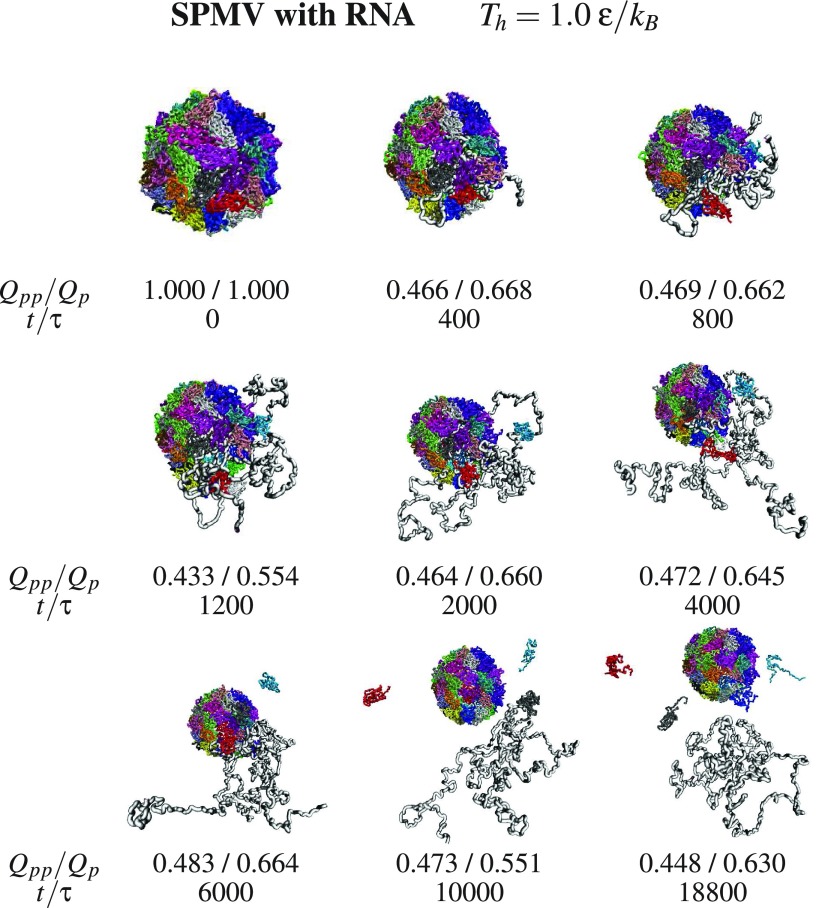
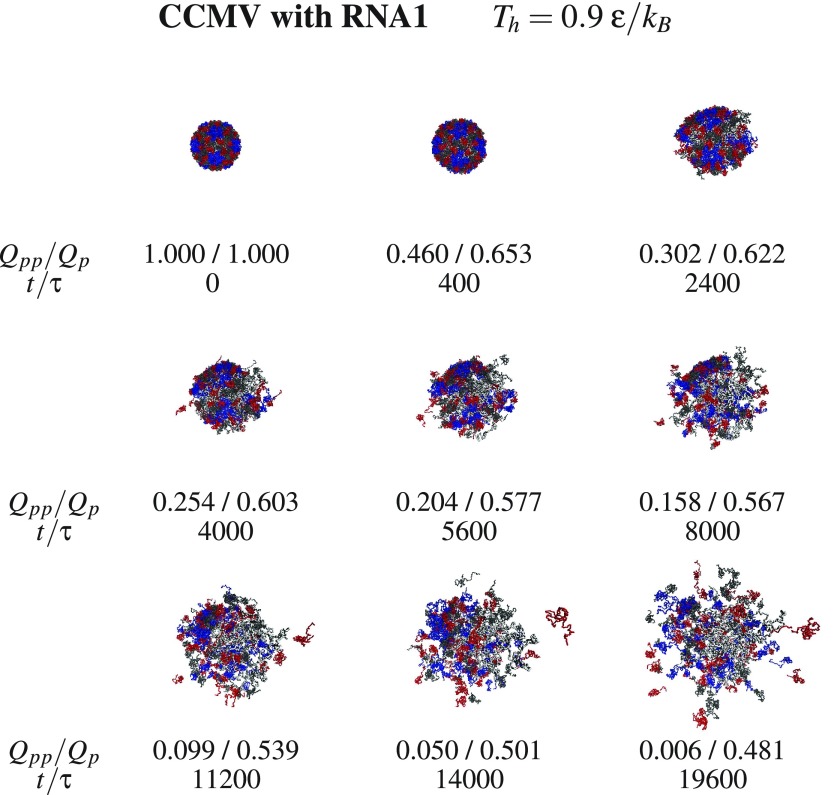
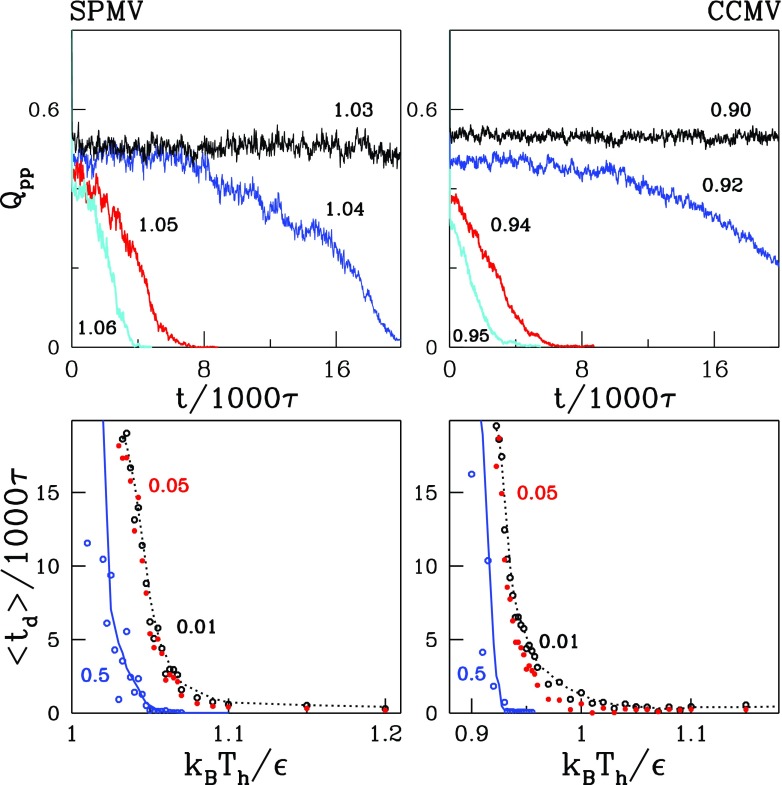
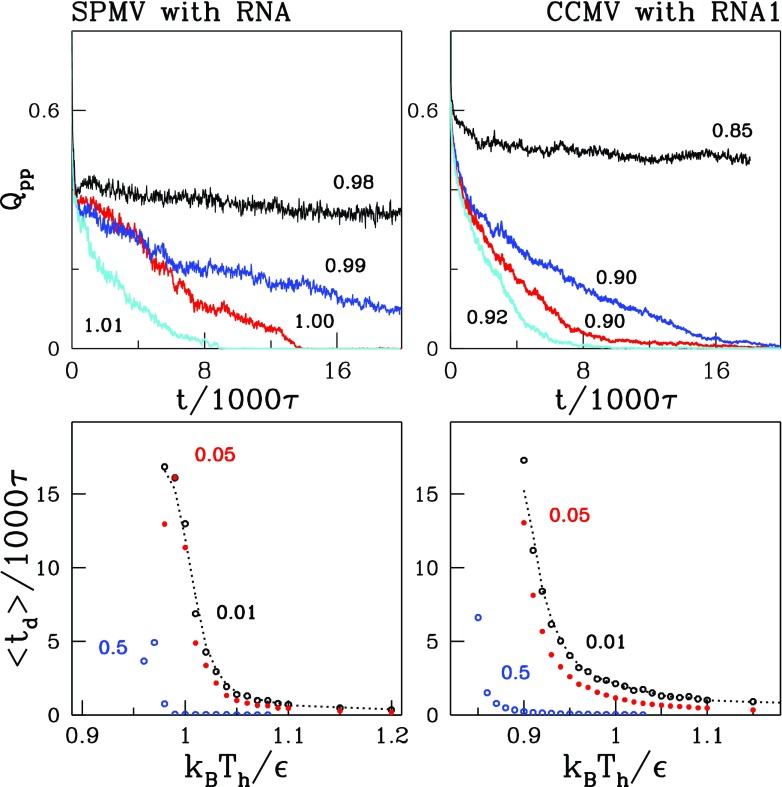
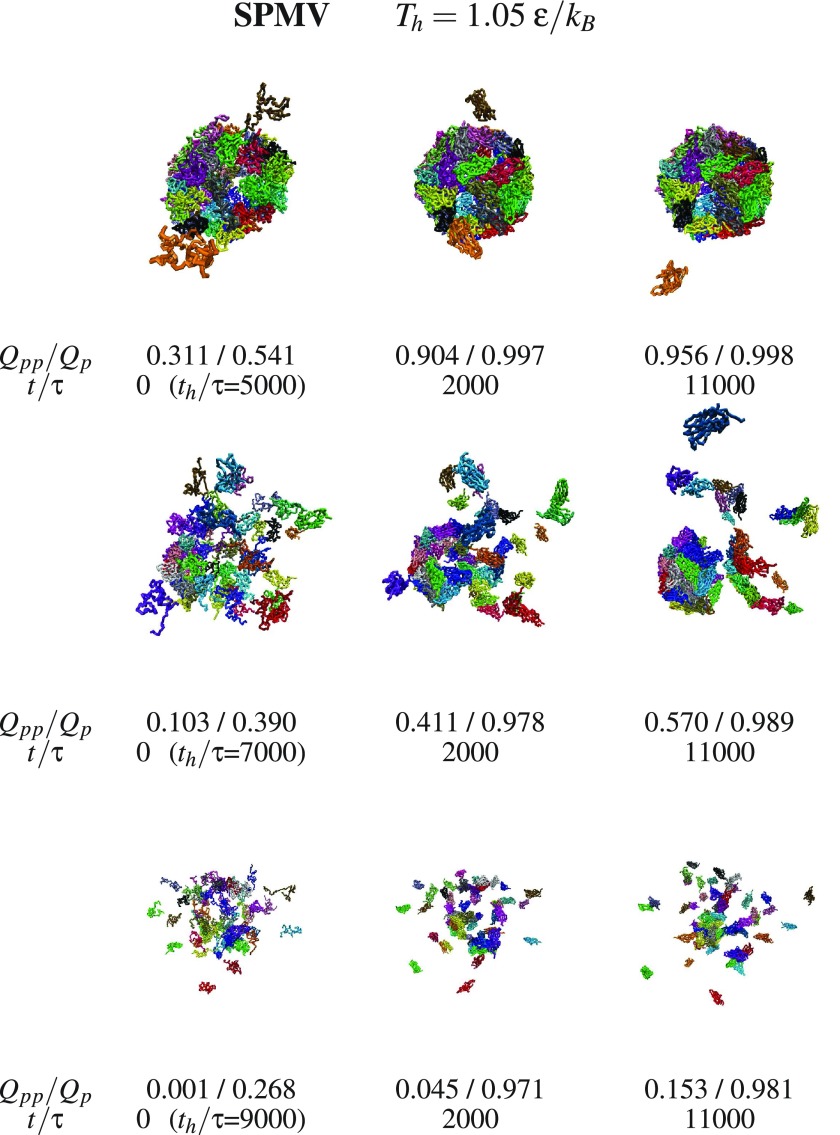
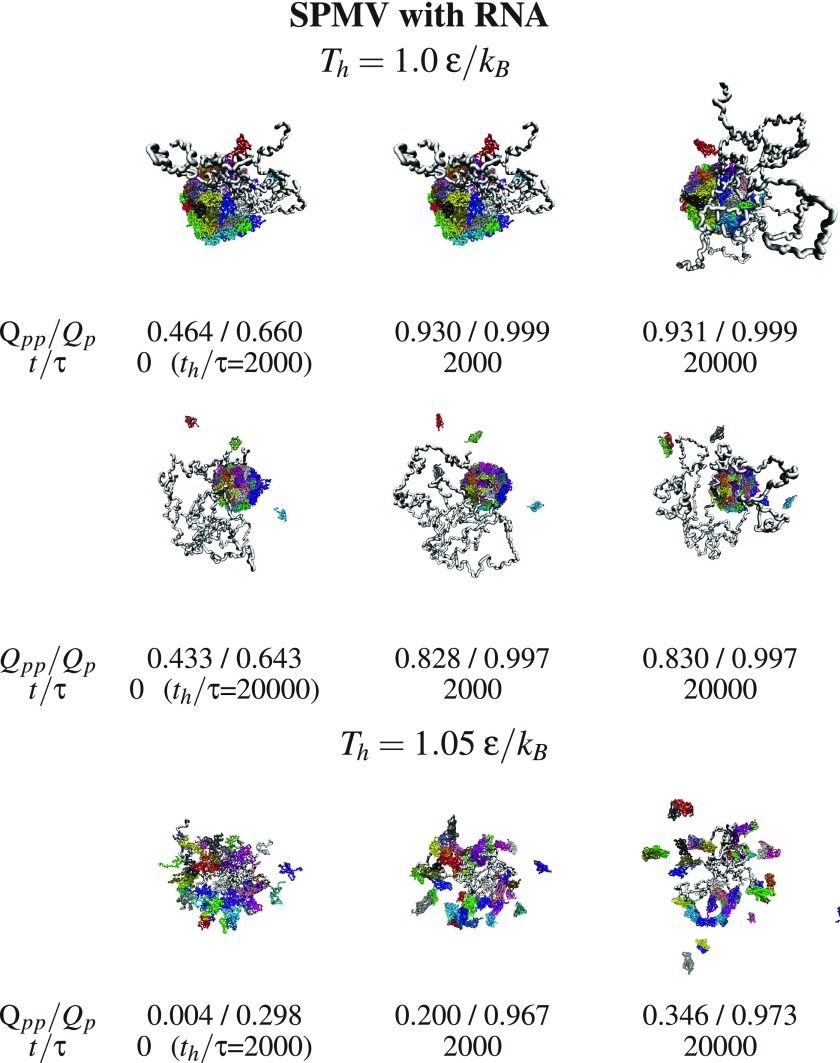
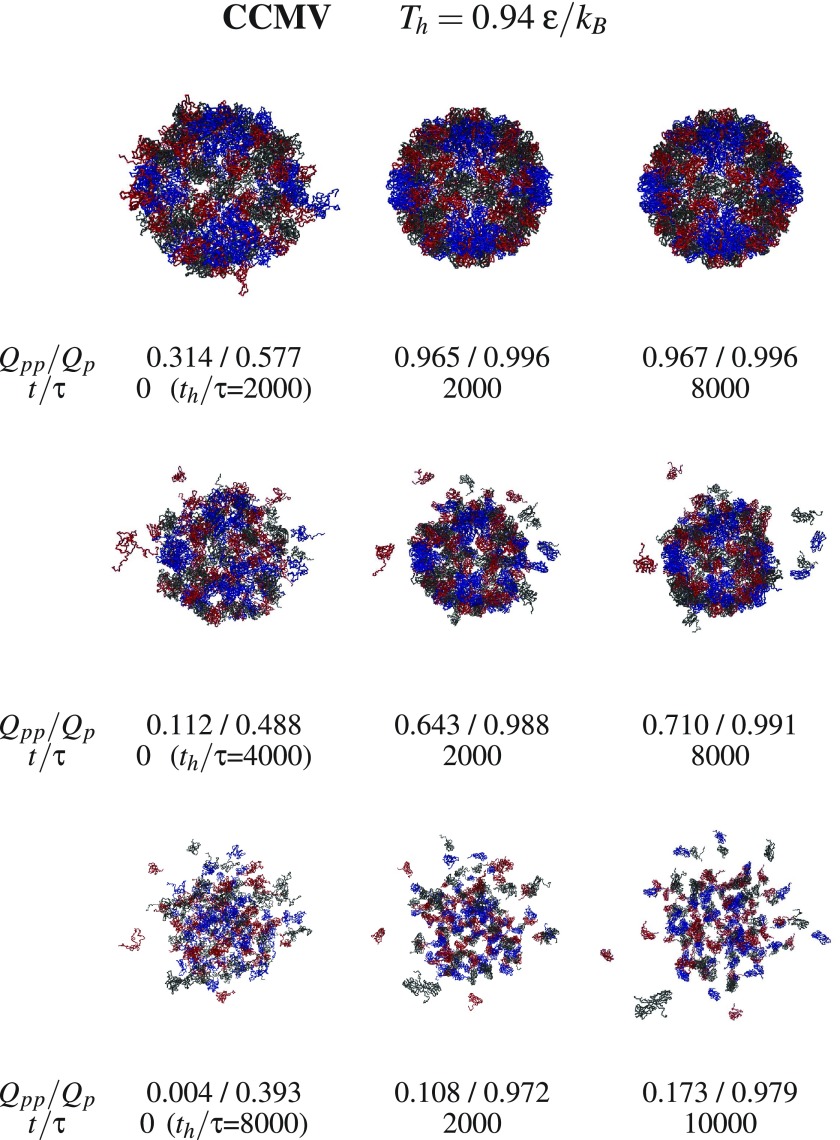
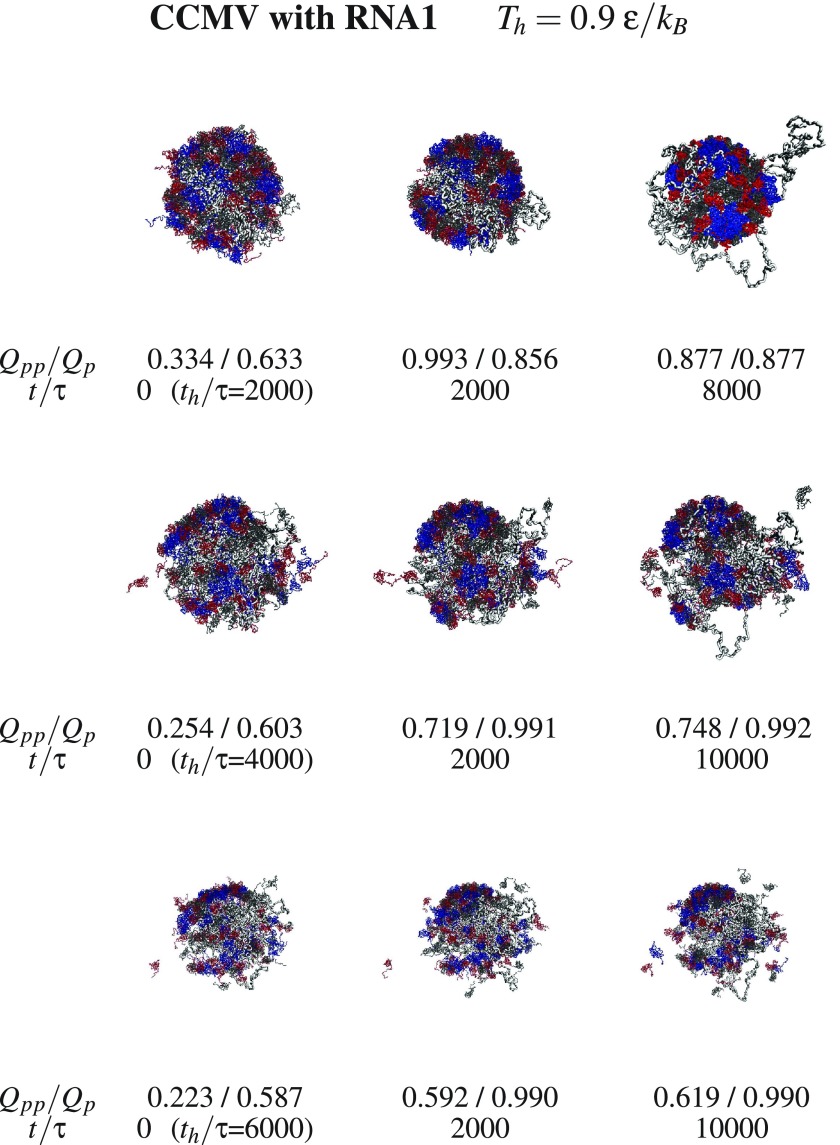
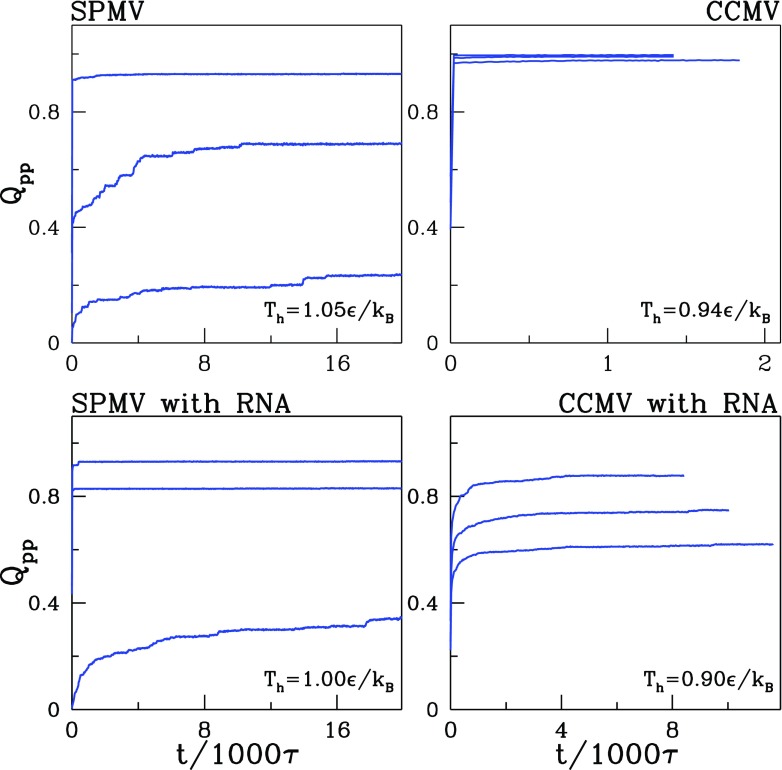
We consider self-assembly of proteins into a virus capsid by the methods of molecular dynamics. The capsid corresponds either to SPMV or CCMV and is studied with and without the RNA molecule inside. The proteins are flexible and described by the structure-based coarse-grained model augmented by electrostatic interactions. Previous studies of the capsid self-assembly involved solid objects of a supramolecular scale, e.g. corresponding to capsomeres, with engineered couplings and stochastic movements. In our approach, a single capsid is dissociated by an application of a high temperature for a variable period and then the system is cooled down to allow for self-assembly. The restoration of the capsid proceeds to various extent, depending on the nature of the dissociated state, but is rarely complete because some proteins depart too far unless the process takes place in a confined space.
Figures
Similar articles
-
Contributions of Charged Residues in Structurally Dynamic Capsid Surface Loops to Rous Sarcoma Virus Assembly.J Virol. 2016 May 27;90(12):5700-5714. doi: 10.1128/JVI.00378-16. Print 2016 Jun 15. J Virol. 2016. PMID: 27053549 Free PMC article.
-
Role of electrostatics in the assembly pathway of a single-stranded RNA virus.J Virol. 2014 Sep;88(18):10472-9. doi: 10.1128/JVI.01044-14. Epub 2014 Jun 25. J Virol. 2014. PMID: 24965458 Free PMC article.
-
The Roles of Electrostatic Interactions in Capsid Assembly Mechanisms of Giant Viruses.Int J Mol Sci. 2019 Apr 16;20(8):1876. doi: 10.3390/ijms20081876. Int J Mol Sci. 2019. PMID: 30995716 Free PMC article.
-
Electrostatic properties of cowpea chlorotic mottle virus and cucumber mosaic virus capsids.Biopolymers. 2006 Jun 5;82(2):106-20. doi: 10.1002/bip.20409. Biopolymers. 2006. PMID: 16278831 Free PMC article.
-
Bacteriophage HK97 capsid assembly and maturation.Adv Exp Med Biol. 2012;726:351-63. doi: 10.1007/978-1-4614-0980-9_15. Adv Exp Med Biol. 2012. PMID: 22297521 Review.
Cited by
-
Application of Recurrence Plot Analysis to Examine Dynamics of Biological Molecules on the Example of Aggregation of Seed Mucilage Components.Entropy (Basel). 2024 Apr 29;26(5):380. doi: 10.3390/e26050380. Entropy (Basel). 2024. PMID: 38785629 Free PMC article.
-
Pseudo-Improper-Dihedral Model for Intrinsically Disordered Proteins.J Chem Theory Comput. 2020 Jul 14;16(7):4726-4733. doi: 10.1021/acs.jctc.0c00338. Epub 2020 Jun 12. J Chem Theory Comput. 2020. PMID: 32436706 Free PMC article.
-
Molecular Dynamics Simulations of Deformable Viral Capsomers.Viruses. 2023 Jul 31;15(8):1672. doi: 10.3390/v15081672. Viruses. 2023. PMID: 37632014 Free PMC article.
References
MeSH terms
Substances
LinkOut - more resources
Full Text Sources
Other Literature Sources