. 2018 Feb;17(1):e12692.
doi: 10.1111/acel.12692. Epub 2017 Oct 12.

Interplay of pathogenic forms of human tau with different autophagic pathways

Affiliations

Interplay of pathogenic forms of human tau with different autophagic pathways

Benjamin Caballero et al. Aging Cell. 2018 Feb.

Abstract

Loss of neuronal proteostasis, a common feature of the aging brain, is accelerated in neurodegenerative disorders, including different types of tauopathies. Aberrant turnover of tau, a microtubule-stabilizing protein, contributes to its accumulation and subsequent toxicity in tauopathy patients' brains. A direct toxic effect of pathogenic forms of tau on the proteolytic systems that normally contribute to their turnover has been proposed. In this study, we analyzed the contribution of three different types of autophagy, macroautophagy, chaperone-mediated autophagy, and endosomal microautophagy to the degradation of tau protein variants and tau mutations associated with this age-related disease. We have found that the pathogenic P301L mutation inhibits degradation of tau by any of the three autophagic pathways, whereas the risk-associated tau mutation A152T reroutes tau for degradation through a different autophagy pathway. We also found defective autophagic degradation of tau when using mutations that mimic common posttranslational modifications in tau or known to promote its aggregation. Interestingly, although most mutations markedly reduced degradation of tau through autophagy, the step of this process preferentially affected varies depending on the type of tau mutation. Overall, our studies unveil a complex interplay between the multiple modifications of tau and selective forms of autophagy that may determine its physiological degradation and its faulty clearance in the disease context.

Keywords: Alzheimer's disease; aging; autophagy; frontotemporal dementia; lysosomes; neurodegeneration.


Figures

Figure 1
Figure 1
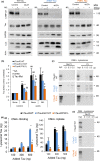
Contribution of CMA to degradation of disease‐related mutant tau proteins. (a) Immunoblots for the indicated proteins of the mouse neuroblastoma cell line Neuro‐2a (N2a) control or knockdown for LAMP2A (siL2A) expressing under the control of a tetracycline promoter tau wild‐type (WT) or tau mutated at residues A152T or P301L. Cells were treated with doxycycline to activate protein expression for 72 h and, where indicated, NH 4Cl 20 mm and leupeptin 100 μm (N/L) were added during the last 4 h of incubation. LC3‐II levels are shown as positive control of the effect of the inhibitors. GAPDH is shown as an example of well‐characterized CMA substrate. Actin is shown for normalization purposes (note that lower relative contribution of actin in the same amount of total protein loaded is a consequence of the accumulation of proteins no longer degraded when CMA is blocked). (b) Quantification of tau levels normalized to actin. Values are expressed relative to those in untreated control cells that were given an arbitrary value of 1. n = 5. Differences after adding N/L (*), upon siRNA (#) or of the mutant tau proteins relative to WT (§) were significant for *,#,§P < 0.05 and **,##,§§P < 0.01. (c) Immunoblots for tau of isolated CMA‐active lysosomes, pretreated or not with protease inhibitors (PI) for 10 min at 4 °C and then incubated with the indicated tau proteins at 37 °C for 20 min. Inpt: input (0.1 μg). (d) Quantification of binding (left) and uptake (right) of tau proteins by the CMA‐active lysosomes. Values are indicated in ng, and were calculated from the densitometric quantification of a known amount of purified protein. n = 5. (e) Immunoblot for tau proteins incubated under the same condition as in c but with CMA‐inactive (−) lysosomes. Input = 0.1 μg. All values are mean ± SEM. Differences with hTau40 WT were significant for *P < 0.05.
Figure 2
Figure 2
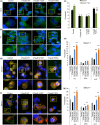
Endosomal microautophagy and macroautophagy of disease‐related mutant tau proteins. (a) Immunoblots for the indicated proteins of the mouse neuroblastoma cell line Neuro‐2a (N2a) control or knockdown for Vps4 A and B (siVps4) expressing under the control of a tetracycline promoter tau wild‐type (WT) or tau mutated at residues A152T or P301L Cells were treated with doxycycline to activate protein expression for 72 h and, where indicated, NH 4Cl 20 mm and leupeptin 100 μm (N/L) were added during the last 4 h of incubation. Actin is shown for normalization purposes (lower relative contribution of actin to total cellular protein in the knockdown cells is a consequence of the accumulation of proteins no longer degraded when e‐MI is blocked in the mutant‐expressing cells). (b) Quantification of tau levels relative to those in untreated control cells that were given an arbitrary value of 1. n = 4. Differences after adding N/L (*), upon siRNA (#) or of the mutant tau proteins relative to WT (§) were significant for *,#,§P < 0.05 and **,##,§§P < 0.01. (c) Immunoblots for tau associated with isolated late endosomes pretreated or not with protease inhibitors (PI) for 10 min at 4 °C and then incubated with the indicated tau proteins at 37 °C for 30 min. Inp: input. (d) Quantification of binding, association, and uptake/degradation of tau proteins by the late endosomes. Values are indicated as percentage of the input, calculated from the densitometric quantification of a known amount of purified protein. n = 4. Differences with hTau40 WT were significant for *P < 0.05. (e) Immunoblots for the indicated proteins of the same cells as in (a) but knockdown for Atg7 (siAtg7). (f) Quantification of tau levels as in (b). n = 3. Significance of the differences is expressed as in (b). All values are mean ± SEM. (g) Scheme of the contribution of different autophagic pathways to the degradation of WT, P301L or A152T mutant tau.
Figure 3
Figure 3
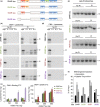
Effect of disease‐related mutant tau proteins on CMA. (a,b) Proteolysis of long‐lived proteins in mouse neuroblastoma cell line Neuro‐2a (N2a) treated with doxycycline to activate expression of the indicated tau proteins. Protein degradation was measured at the indicated times, in cells maintained in the presence (a) or absence (b) of serum, as the amount of acid‐precipitable radioactivity (amino acids and small peptides) released into the media. n = 3 different experiments with triplicate wells. (c–g) Same N2a cells as in a, were treated with doxycycline for 72 h and then transduced with lentivirus carrying the KFERQPS‐Dendra2 reporter and maintained in the presence (c) or absence of serum (d) or in the presence of paraquat (PQ) (f) or thapsigargin (TG) (g) at the indicated concentrations. Representative images of cells maintained in the presence (c) or absence (d) of serum 16 h after photoswitching. Insets show higher magnification. Nuclei were stained with DAPI. (e) Quantification of average number of puncta per cell section in experiments as the ones in c and d. (f–g) Quantification of average number of puncta per cell in absolute values (left) or relative to the number in untreated cells (right) in experiments as in c but in the presence of paraquat (f) or thapsigargin (g). n > 800 cells/condition in three different experiments with triplicate wells. All values are mean ± SEM. Differences are significant for *P < 0.05 and **P < 0.01.
Figure 4
Figure 4
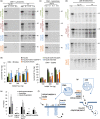
Effect of disease‐related mutant tau proteins on different autophagic pathways. (a,b) Representative images of mouse neuroblastoma cell lines Neuro‐2a (N2a) treated with doxycycline to activate expression of the indicated tau proteins and transduced with lentivirus carrying the N‐KFERQmVenus and C‐KFERQmVenus. Cells were incubated without additions (a) or in the presence of NH 4Cl 20 mm and leupeptin 100 μm (N/L) for 4 h (b). Insets show higher magnification. Nuclei were stained with DAPI. (c) Quantification of average number of puncta per cell section in experiments as the ones in a and b. n > 800 cells/condition in three different wells. (d, f) Representative images of N2a treated as in a, but transduced with lentivirus carrying the mCherry‐GFPLC3 reporter and maintained in the presence (d) or absence (f) of serum. Nuclei are highlighted with DAPI in blue. Insets show higher magnification images. (e,g) Quantification of total number of autophagic vacuoles (AV), autophagosomes (APG, yellow puncta) and autolysosomes (AUTL, only red puncta) in cells maintained in the presence (e) or absence (g) of serum. n > 800 cells/condition in three experiments with triplicate wells. All values are mean ± SEM. Differences with untreated (#) or with control (*) were significant for *,#P < 0.05 and **,##P < 0.01.
Figure 5
Figure 5
Degradation of different tau isoforms by selective autophagic pathways. (a) Scheme of the domain composition of the different tau isoforms analyzed in this study. (b) Immunoblots for tau of isolated CMA‐active lysosomes pretreated or not with protease inhibitors (PI) for 10 min at 4 °C and then incubated with the indicated concentrations (μg) of tau proteins at 37 °C for 20 min. Inpt: input. (c) Quantification of binding (left) and uptake (right) of tau proteins by the CMA‐active lysosomes. Values are indicated in ng, calculated from the densitometric quantification of a known amount of purified protein. n = 5. (d) Immunoblot of tau proteins incubated under the same condition as in b but with CMA‐inactive (−) lysosomes. (e) Immunoblots for tau in isolated late endosomes pretreated or not with protease inhibitors (PI) for 10 min at 4 °C and then incubated with the indicated tau proteins (0.5 μg) at 37 °C for 30 min. (f) Quantification of binding, association, and uptake/degradation of tau proteins by the late endosomes. Values are indicated as percentage of the input, calculated from the densitometric quantification of a known amount of purified protein. n = 4. All values are mean ± SEM. Differences with hTau40 WT were significant for *P < 0.05 and **P < 0.001.
Figure 6
Figure 6
Degradation of aggregate‐prone mutant tau (hTau40 ΔK280) by selective autophagic pathways. (a) Immunoblots for tau of isolated CMA‐active lysosomes, pretreated or not with protease inhibitors (PI) for 10 min at 4 °C and then incubated with the indicated concentrations of wild‐type tau (hTau40), tau with lysine 280 deleted (hTau40 ΔK280) or with lysine 280 replaced with two proline residues to disrupt β propensity (hTau40 ΔK280/2P) at 37 °C for 30 min. Inpt: input. (b) Quantification of binding (left) and uptake (right) of the tau proteins by the CMA‐active lysosomes. Values are indicated in ng, calculated from the densitometric quantification of a known amount of purified protein. n = 4. (c) Immunoblot of tau proteins incubated under the same condition as in b but with CMA‐inactive (‐) lysosomes. (d) Immunoblots for tau in isolated late endosomes pretreated or not with protease inhibitors (PI) for 10 min at 4 °C and then incubated with the indicated tau proteins (0.5 μg) at 37 °C for 30 min. (e) Quantification of binding, association, and uptake/degradation of tau proteins by the late endosomes. Values are indicated as percentage of the input, calculated from the densitometric quantification of a known amount of purified protein. n = 3. All values are mean ± SEM. Differences with hTau40 WT (*) or between the mutants (#) were significant for *,#P < 0.05 and **,P < 0.01.
Figure 7
Figure 7
Effect of oxidation and pseudophosphorylation on the degradation of tau by selective autophagic pathways. (a) Immunoblots for tau of isolated CMA‐active lysosomes, pretreated or not with protease inhibitors (PI) for 10 min at 4 °C and then incubated with tau with cysteine 291 and 322 replaced by alanine (hTau40 C291A/C322A), or with mutations S199E+S292E+T214E (AT8 site), plus T212E+S214E (AT100) plus S396E+S404E (PHF‐1) (to yield htau40 AT8/AT100/PHF‐1), with serine 262, 293, 324, and 356 replaced by glutamic acid (4xKXGE) (to mimic hyperphosphorylation) or with alanine (4xKXGA) (to disrupt phosphorylation). Proteins were added at the indicated concentrations and incubations were performed at 37 °C for 20 min. Inpt: input. (b) Quantification of binding (left) and uptake (right) of the tau proteins by the CMA‐active lysosomes. Values are indicated in ng, calculated from the densitometric quantification of a known amount of purified protein. n = 3. (c) Immunoblot of tau proteins incubated under the same condition as in b but with rat CMA‐inactive (−) lysosomes. (d) Immunoblots for tau in isolated rat late endosomes pretreated or not with protease inhibitors (PI) for 10 min at 4 °C and then incubated with the indicated tau proteins (0.5 μg) at 37 °C for 30 min. (e) Quantification of binding, association, and uptake/degradation of tau proteins by the late endosomes. Values are indicated as percentage of the input, calculated from the densitometric quantification of a known amount of purified protein. n = 3. All values are mean ± SEM. Differences with hTau40 WT (*) or between the mutants (#) were significant for *P < 0.05 and **P < 0.001. (f) Scheme of the steps of CMA disrupted for each of the indicated tau variants. 1. Targeting; 2. binding; 3. internalization; and 4. degradation. (g) Scheme of the steps of e‐MI disrupted for each of the indicated tau variants. 1. Targeting; 2. binding; 3. internalization; and 4. degradation.

Similar articles

Cited by

References

    1. Aniento F, Roche E, Cuervo AM, Knecht E (1993) Uptake and degradation of glyceraldehyde‐3‐ phosphate dehydrogenase by rat liver lysosomes. J. Biol. Chem. 268, 10463–10470. - PubMed
    1. Bandyopadhyay U, Sridhar S, Kaushik S, Kiffin R, Cuervo AM (2010) Identification of regulators of chaperone‐mediated autophagy. Mol. Cell 39, 535–547. - PMC - PubMed
    1. Barghorn S, Mandelkow E (2002) Toward a unified scheme for the aggregation of tau into Alzheimer paired helical filaments. Biochemistry 41, 14885–14896. - PubMed
    1. Barghorn S, Zheng‐Fischhofer Q, Ackmann M, Biernat J, von Bergen M, Mandelkow EM, Mandelkow E (2000) Structure, microtubule interactions, and paired helical filament aggregation by tau mutants of frontotemporal dementias. Biochemistry 39, 11714–11721. - PubMed
    1. Barghorn S, Biernat J, Mandelkow E (2005) Purification of recombinant tau protein and preparation of Alzheimer‐paired helical filaments in vitro . Methods Mol. Biol. 299, 35–51. - PubMed

Publication types

LinkOut - more resources