. 2017 Dec 1;77(23):6746-6758.
doi: 10.1158/0008-5472.CAN-17-0930. Epub 2017 Oct 11.

Glutamine Addiction in Kidney Cancer Suppresses Oxidative Stress and Can Be Exploited for Real-Time Imaging

Affiliations

Glutamine Addiction in Kidney Cancer Suppresses Oxidative Stress and Can Be Exploited for Real-Time Imaging

Omran Abu Aboud et al. Cancer Res. .

Abstract

Many cancers appear to activate intrinsic antioxidant systems as a means to counteract oxidative stress. Some cancers, such as clear cell renal cell carcinoma (ccRCC), require exogenous glutamine for growth and exhibit reprogrammed glutamine metabolism, at least in part due to the glutathione pathway, an efficient cellular buffering system that counteracts reactive oxygen species and other oxidants. We show here that ccRCC xenograft tumors under the renal capsule exhibit enhanced oxidative stress compared with adjacent normal tissue and the contralateral kidney. Upon glutaminase inhibition with CB-839 or BPTES, the RCC cell lines SN12PM-6-1 (SN12) and 786-O exhibited decreased survival and pronounced apoptosis associated with a decreased GSH/GSSG ratio, augmented nuclear factor erythroid-related factor 2, and increased 8-oxo-7,8-dihydro-2'-deoxyguanosine, a marker of DNA damage. SN12 tumor xenografts showed decreased growth when treated with CB-839. Furthermore, PET imaging confirmed that ccRCC tumors exhibited increased tumoral uptake of 18F-(2S,4R)4-fluoroglutamine compared with the kidney in the orthotopic mouse model. This technique can be utilized to follow changes in ccRCC metabolism in vivo Further development of these paradigms will lead to new treatment options with glutaminase inhibitors and the utility of PET to identify and manage patients with ccRCC who are likely to respond to glutaminase inhibitors in the clinic. Cancer Res; 77(23); 6746-58. ©2017 AACR.


Conflict of interest statement

Conflicts of interest: none

Figures

Fig. 1
Fig. 1
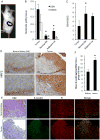
RCC tumors show higher oxidative stress as compared to adjacent normal and contralateral renal tissues. A. SN12-PM6-1 (SN12) cells were implanted under the renal capsule of the left kidney in SCID mice and whole body bioluminescence imaging was acquired in the three animal experiments as described in Materials and Methods. A representative imaged mouse is shown. B. The metabolites GSH and GSSG were measured in RCC tumors, tumor-adjacent normal tissue in left kidney (LK), and untouched right kidney (RK) in untreated mice (n=3). Data are mean ± SEM. *p<0.05 compared to tumor tissue. For GSH, p=0.008 for tumor vs RK and p=0.032 for tumor vs LK. For GSSG p=0.006 for tumor vs RK and p=0.071 for tumor vs LK). Results shown are representative of at least three independent experiments C. The ratio of GSH/GSSG from the same measurements in Fig.1B were calculated in RCC tumors, adjacent renal tissue in left kidney (LK) and tissue from right kidney (RK) (n=3/group). Error bars are SEM. *p<0.05 compared to tumor tissue. For tumor vs RK p=.023, tumor vs LK p=.069. Results shown are representative of at least two independent experiments D. Representative sections of normal right kidney and tumor tissues were subjected to immunoperoxidase staining for NRF2. E. Representative sections of normal and tumor kidney tissues were subjected to immunofluorescence staining for 8-oxodG and propidium iodide (PI; nuclear stain). F. Quantitation of 8-oxodG levels were measured in the DNA of RCC tumors and normal kidney tissues from 5 mice, which were randomly selected from 10 untreated mice, and the average is shown. Data are mean ±SEM. *p<0.05 tumor compared to normal kidney (p=.006).
Fig. 2
Fig. 2
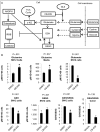
Inhibition of glutaminase with CB-839 attenuates the glutathione pathway in RCC. A. The antioxidant pathways that neutralize reactive oxygen species (ROS). The glutamine pathway is reprogrammed in ccRCC to increase production of glutathione (GSH) and oxidized glutathione (GSSG). Glutamate, cysteine and glycine are required to synthesize GSH. The conversion of glutamine to glutamate is regulated by glutaminase (GLS), which can be targeted and inhibited by CB-839 (or BPTES). Thioredoxin also reduces ROS levels and is generated by NADPH, which in turn regulates the conversion of GSH and GSSG. Catalase is another pathway, NADPH independent, which reduces ROS. B. SN12 cells were incubated with 1μM CB-839 or DMSO for 24 h (n=3/group). The cells and conditioned media were obtained and analyzed by HPLC-MS/MS for the metabolites indicated as described in Materials and Methods. Data are mean ±SD. *p<0.05 compared to DMSO treated cells. For tumor tissue (far right panel), tissues were collected form the second animal experiment (orally dosed with vehicle or CB-839; n=5/group) and GSH and GSSG were measured using the GSH/GSSG Kit from Promega. Data are mean ±SEM.
Fig. 3
Fig. 3
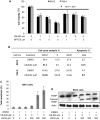
CB-839 inhibits RCC cell viability by inducing both cell cycle arrest and apoptosis in SN12 and 786-O RCC cells A. SN12 and 786-O cells were grown and incubated with DMSO, CB-839 or BPTES at the concentrations indicated for 72 h (n=8 wells/group) and then subjected to MTT assay. Data are mean ±SD. *p<0.001 compared to DMSO control. Results shown are representative of at least three independent experiments. B. SN12 and 786-O cells were grown and incubated with CB-839 or DMSO (1 μM) for 72 h (n=3/group). Cell cycle populations and total apoptosis were measured by flow cytometry of stained cells. Results shown are representative of at least three independent experiments C. SN12 cells were grown and incubated with CB-839 at the concentrations indicated for 20 h followed by 4 h H2O2 where indicated (n=3/group). Total apoptosis was measured by Annexin V and 7-AAD staining using flow cytometry. Percentages of total apoptosis are plotted. The results shown are representative of at least three independent experiments. Data are mean ±SD. D. At the same conditions in C, levels of cleaved PARP were measured by immunoblotting. The results shown are representative of at least three independent experiments.
Fig. 4
Fig. 4
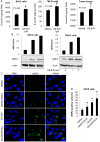
Glutaminase inhibition augments oxidative stress in SN12 and 786-O cells and tumor tissue. A. SN12 and 786-O cells were grown, incubated with 1 μM CB-839 or DMSO for 24 h, and 8-oxodG levels were measured (left panels). Data are mean ±SD. *p<0.05 compared to control (DMSO). Tumor tissues from the second animal experiment (orally dosed with vehicle or CB-839) were harvested and 8-oxodG levels were quantified (right panel). Data are mean ±SEM. *p<0.05 vehicle treated group as compared to CB-839 treated group (n=4). B. SN12 and 786-O cells were grown and incubated with CB-839 or DMSO at the concentrations indicated for 24 h. NRF2 levels in whole cell lysates were measured by immunoblotting. Densitometry relative to loading controls is shown. C. SN12 cells were grown and treated with CB-839 or DMSO at the concentrations and time indicated, followed by H2O2 treatment (where indicated) for 4 h. The cells were fixed and subjected to immunofluorescence staining with NRF2 (green) and DAPI (blue), then visualized with confocal laser-scanning microscopy. The results shown are representative of at least two independent experiments. D. For each treatment in C group, five randomly selected microscopic fields (40×) of NRF2 positively stained cells were counted. Data are mean ±SD. *p<0.05 compared to DMSO control.
Fig. 5
Fig. 5
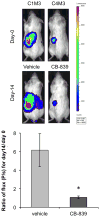
CB-839 significantly attenuates tumor growth in an orthotopic RCC mouse model A. SN12 cells were injected under the left kidney capsule of SCID mice (n=8 per condition; third animal experiment). After 3 weeks two mice were dosed orally twice a day with vehicle or 200 mg/kg CB-839 for 2 weeks. Weekly BLIs was performed to monitor tumor progression. In vivo BLI for one representative mouse per group before and after CB-839 treatment is shown demonstrating significant reduction in tumor growth with CB-839 after 2 weeks. Color scale for all images was set on a minimum of 500 and a maximum of 6000 counts. B. ROI for all BLI images (n=8 mice per group) before and after treatment were designated inside the primary tumor sites on the left kidney and quantified as a mean of total flux (photons/second (P/s)) using the Living Image software. The ratio of flux (P/s) at day 14/day 0 for each animal was calculated and the average presented for each treatment group. Data are mean ± SEM. *p=0.013.
Fig. 6
Fig. 6
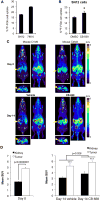
18F-FGln cell uptake and 4-[18F]fluoroglutamine-PET imaging A. Intracellular uptake of an 4-[18F]fluoroglutamine tracer after 30 min incubation in SN12 and 786-O RCC cell lines. (n=3 for each cell line). The Y-axis represents % uptake of total radioactivity by the cells. Data are mean ± SD. B. 4-[18F]fluoroglutamine uptake in SN12 cells after 4 h incubation with 1 μM CB-839 (n=3) or DMSO (n=3) and 30 min with the 4-[18F]fluoroglutamine. The Y-axis represents % of total radioactivity contained in each group of cells. Data are mean ± SD *p<0.05 compared to DMSO control. C. Representative mouse images from each treatment group are presented. Coronal and axial sections from PET (color) are overlaid on CT images (grayscale). Adjacent to each coronal PET/CT image is the coronal whole body maximum intensity projection generated from the PET. Yellow arrows point to tumors. D. Comparison of 18F-FGln uptake in the tumors compared to the right normal kidneys at day 0 (n=10) and day 14 of treatment (n=5/group). Two regions of interest (ROIs; 19.06 mm3 ellipsoids) were drawn on the PET images of each mouse, one on the tumor and one on the right kidney (kidney). Mean standardized uptake value (SUV) of 18F-FGln for each ROI was calculated using AMIDE software. Data are mean ± SEM. ***p=0.002 for tumor compared to right kidney.

Similar articles

Cited by

References

    1. Day AM, Brown JD, Taylor SR, Rand JD, Morgan BA, Veal EA. Inactivation of a peroxiredoxin by hydrogen peroxide is critical for thioredoxin-mediated repair of oxidized proteins and cell survival. Molecular cell. 2012;45:398–408. - PubMed
    1. Schieber M, Chandel NS. ROS function in redox signaling and oxidative stress. Current biology: CB. 2014;24:R453–62. - PMC - PubMed
    1. Wu Q, Ni X. ROS-mediated DNA methylation pattern alterations in carcinogenesis. Current drug targets. 2015;16:13–9. - PubMed
    1. Bielski BH, Arudi RL, Sutherland MW. A study of the reactivity of HO2/O2- with unsaturated fatty acids. The Journal of biological chemistry. 1983;258:4759–61. - PubMed
    1. Finkel T. Redox-dependent signal transduction. FEBS letters. 2000;476:52–4. - PubMed

MeSH terms