

ESRP1 is overexpressed in ovarian cancer and promotes switching from mesenchymal to epithelial phenotype in ovarian cancer cells
- PMID: 28991261
- PMCID: PMC5668885
- DOI: 10.1038/oncsis.2017.87
ESRP1 is overexpressed in ovarian cancer and promotes switching from mesenchymal to epithelial phenotype in ovarian cancer cells
Erratum in
-
ESRP1 is overexpressed in ovarian cancer and promotes switching from mesenchymal to epithelial phenotype in ovarian cancer cells.Oncogenesis. 2017 Nov 20;6(11):e391. doi: 10.1038/oncsis.2017.89. Oncogenesis. 2017. PMID: 29155418 Free PMC article.
-
Correction: ESRP1 is overexpressed in ovarian cancer and promotes switching from mesenchymal to epithelial phenotype in ovarian cancer cells.Oncogenesis. 2019 Aug 29;8(9):47. doi: 10.1038/s41389-019-0155-x. Oncogenesis. 2019. PMID: 31467265 Free PMC article.
Abstract
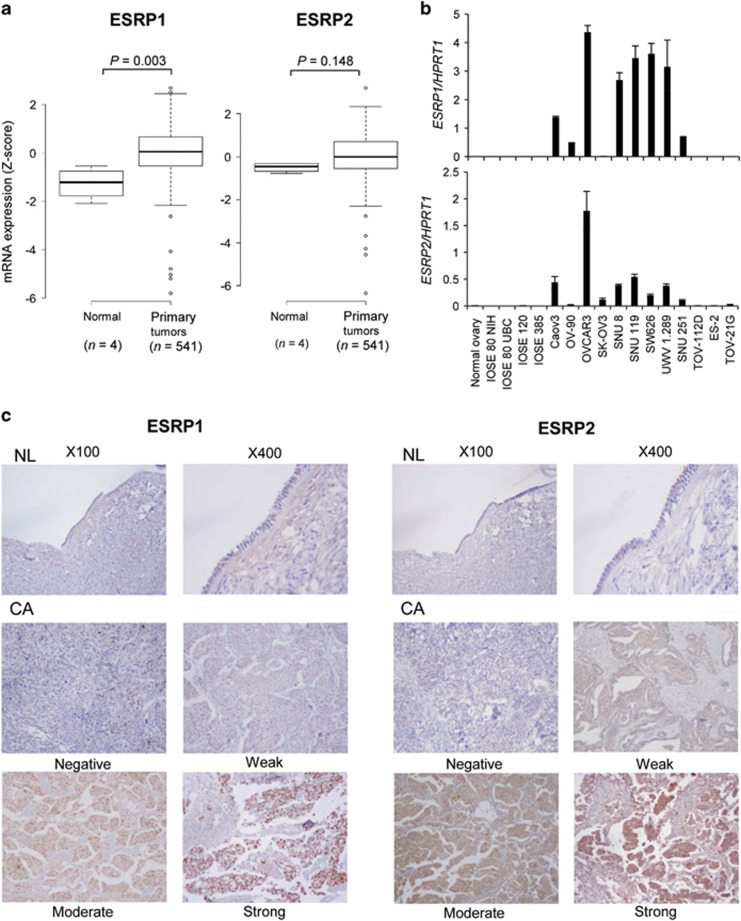
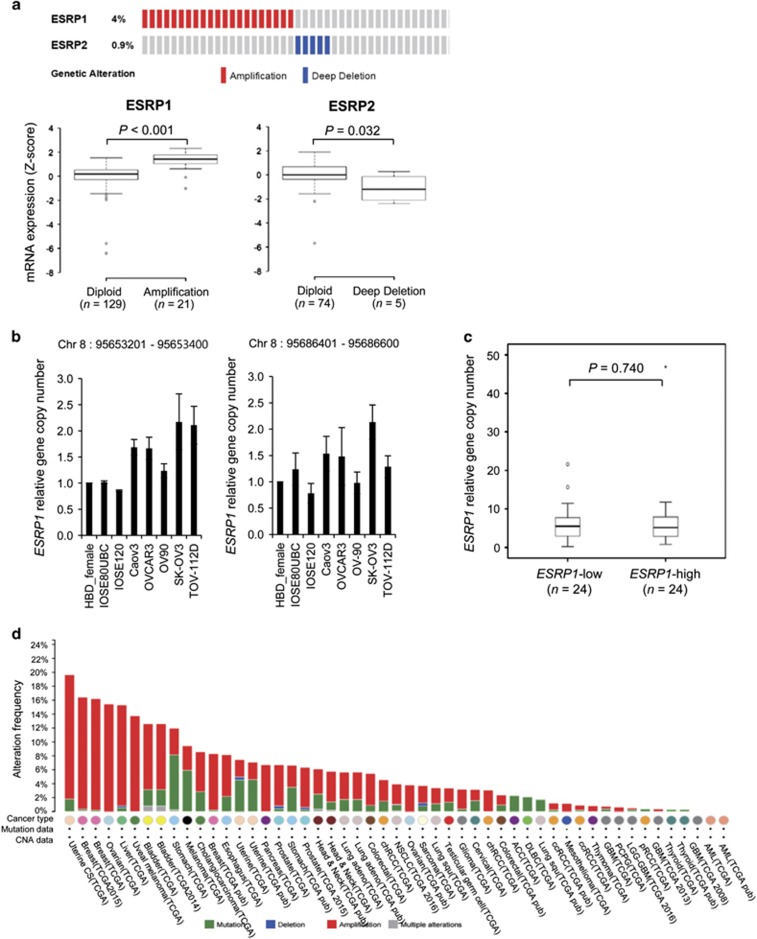
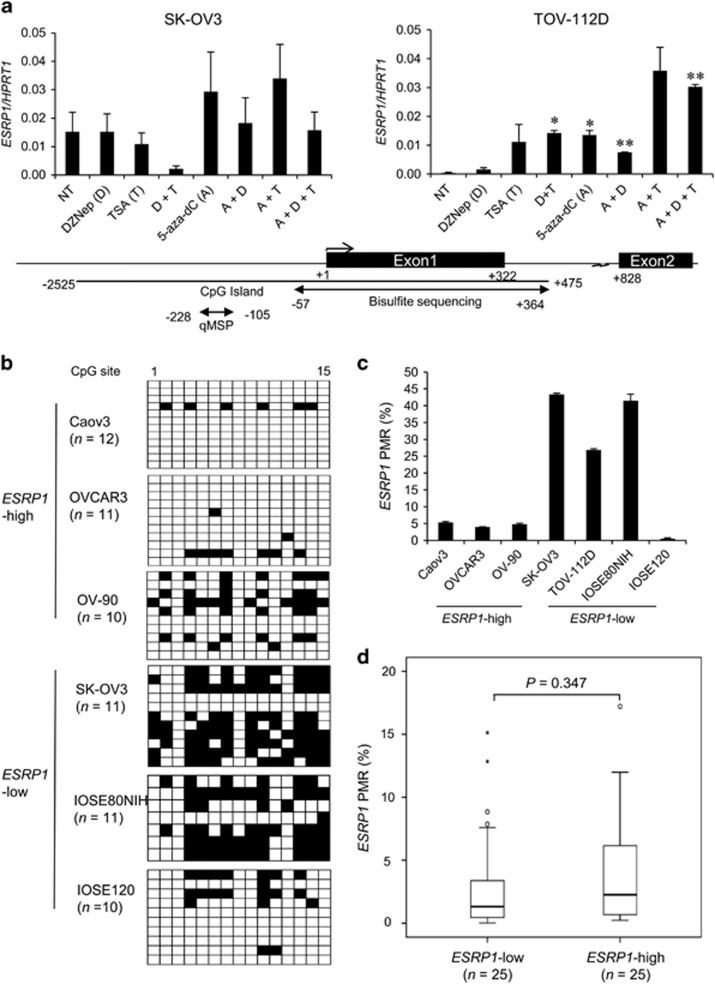
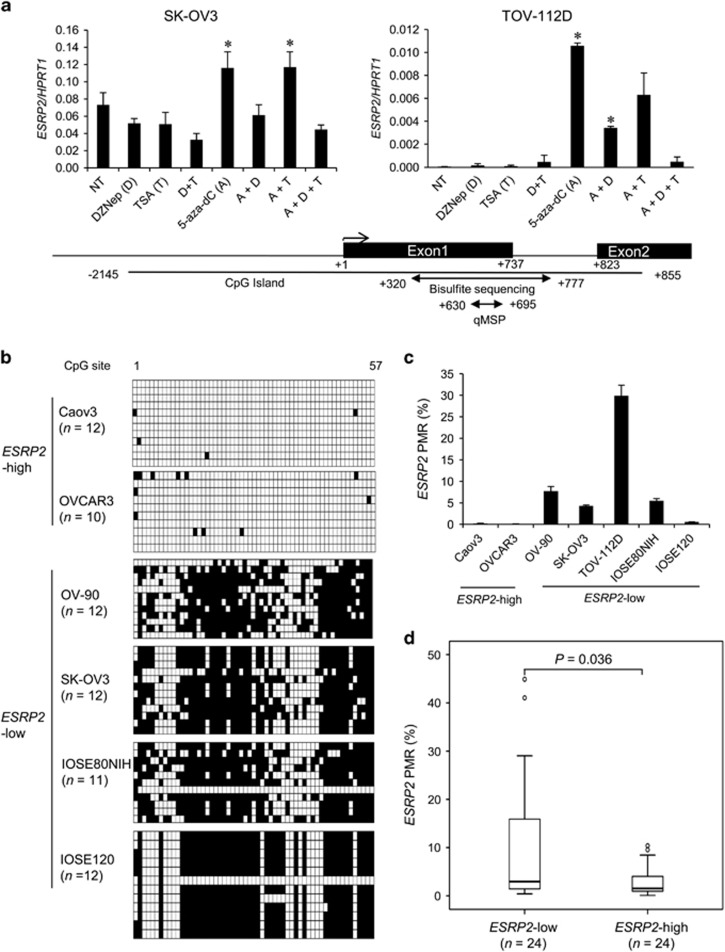
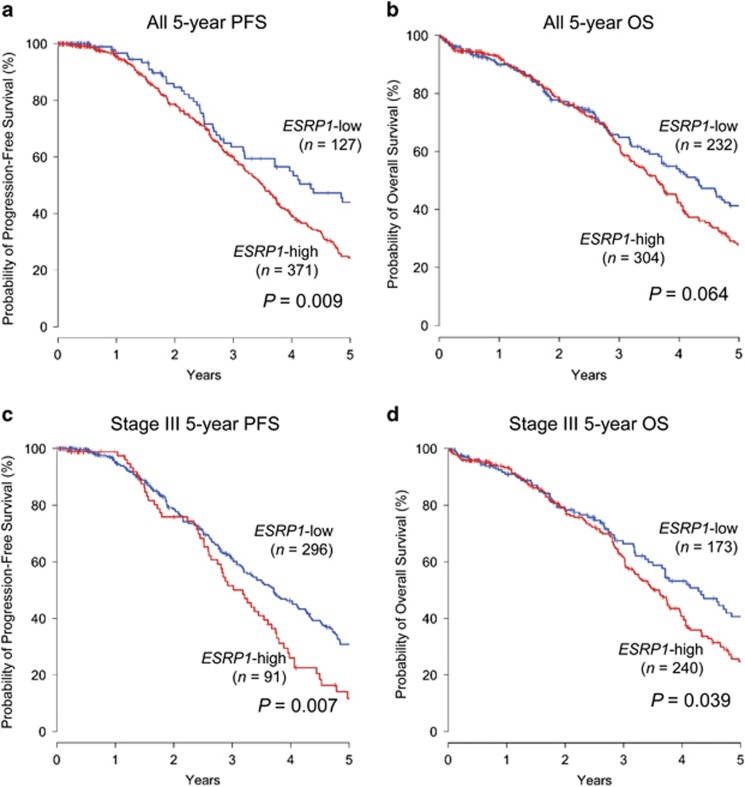
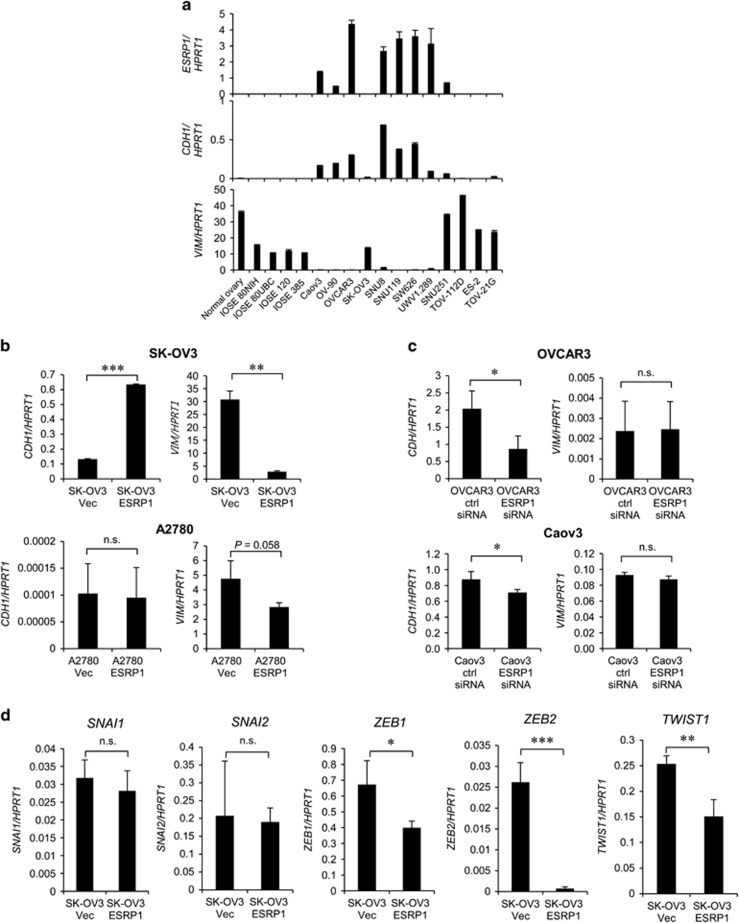
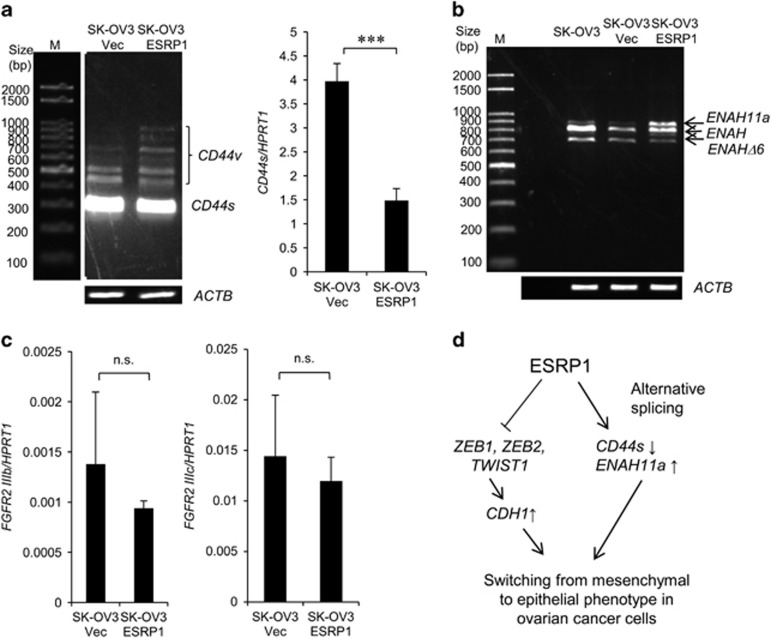
Epithelial splicing regulatory protein 1 (ESRP1) and 2 (ESRP2), epithelial cell-specific regulators of alternative splicing, are downregulated during the epithelial-mesenchymal transition (EMT). These factors have roles in tumor progression and metastasis in some cancers; however, their expression and function in ovarian cancer (OC) remain unclear. We found that ESRP1 and ESRP2 mRNAs were expressed at higher levels in OC cells than in immortalized ovarian surface epithelial (IOSE) cells, and confirmed their overexpression in OC tissues at the protein level. The Cancer Genome Atlas (TCGA) data analysis revealed frequent gene amplification of ESRP1 in OC tissues; however, we detected no significant correlation between ESRP1 gene copy number and gene expression in OC cells. Importantly, expression of ESRP1 and ESRP2 was inversely correlated with DNA methylation in OC cells, and ESRP2 overexpression in OC tissues was significantly associated with DNA hypomethylation. Notably, survival analysis using TCGA data from 541 OC tissues revealed that high ESRP1 expression was significantly associated with shorter 5-year survival of patients. Ectopic ESRP1 expression in mesenchymal OC cells promoted cell proliferation but suppressed cell migration. Furthermore, we found that ESRP1 drives a switch from mesenchymal to epithelial phenotype characterized by reduced cell migration in association with induction of epithelial cell-specific variant of CD44 and ENAH. Taken together, our findings suggest that an epigenetic mechanism is involved in ESRP1 overexpression, and that ESRP1 has a role in OC progression.
Conflict of interest statement
The authors declare no conflict of interest.
Figures

Similar articles
-
Role of epithelial splicing regulatory protein 1 in cancer progression.Cancer Cell Int. 2023 Dec 18;23(1):331. doi: 10.1186/s12935-023-03180-6. Cancer Cell Int. 2023. PMID: 38110955 Free PMC article. Review.
-
Overexpression of Epithelial Splicing Regulatory Protein 1 in Metastatic Lesions of Serous Ovarian Carcinoma Correlates with Poor Patient Prognosis.Cancer Biother Radiopharm. 2022 Nov;37(9):850-861. doi: 10.1089/cbr.2021.0215. Epub 2021 Sep 8. Cancer Biother Radiopharm. 2022. PMID: 34495766
-
Snail Driving Alternative Splicing of CD44 by ESRP1 Enhances Invasion and Migration in Epithelial Ovarian Cancer.Cell Physiol Biochem. 2017;43(6):2489-2504. doi: 10.1159/000484458. Epub 2017 Oct 31. Cell Physiol Biochem. 2017. PMID: 29131012
-
Epithelial splicing regulatory proteins 1 (ESRP1) and 2 (ESRP2) suppress cancer cell motility via different mechanisms.J Biol Chem. 2014 Oct 3;289(40):27386-99. doi: 10.1074/jbc.M114.589432. Epub 2014 Aug 20. J Biol Chem. 2014. PMID: 25143390 Free PMC article.
-
Roles and Regulation of Epithelial Splicing Regulatory Proteins 1 and 2 in Epithelial-Mesenchymal Transition.Int Rev Cell Mol Biol. 2016;327:163-194. doi: 10.1016/bs.ircmb.2016.06.003. Epub 2016 Jul 30. Int Rev Cell Mol Biol. 2016. PMID: 27692175 Review.
Cited by
-
Role of epithelial splicing regulatory protein 1 in cancer progression.Cancer Cell Int. 2023 Dec 18;23(1):331. doi: 10.1186/s12935-023-03180-6. Cancer Cell Int. 2023. PMID: 38110955 Free PMC article. Review.
-
Epigenetic changes in fibroblasts drive cancer metabolism and differentiation.Endocr Relat Cancer. 2019 Dec;26(12):R673-R688. doi: 10.1530/ERC-19-0347. Endocr Relat Cancer. 2019. PMID: 31627186 Free PMC article. Review.
-
Presence of spontaneous epithelial-mesenchymal plasticity in esophageal cancer.Biochem Biophys Rep. 2022 Mar 19;30:101246. doi: 10.1016/j.bbrep.2022.101246. eCollection 2022 Jul. Biochem Biophys Rep. 2022. PMID: 35330672 Free PMC article.
-
E2F1 and epigenetic modifiers orchestrate breast cancer progression by regulating oxygen-dependent ESRP1 expression.Oncogenesis. 2021 Aug 6;10(8):58. doi: 10.1038/s41389-021-00347-6. Oncogenesis. 2021. PMID: 34362878 Free PMC article.
-
Molecular Evolution of Early-Onset Prostate Cancer Identifies Molecular Risk Markers and Clinical Trajectories.Cancer Cell. 2018 Dec 10;34(6):996-1011.e8. doi: 10.1016/j.ccell.2018.10.016. Cancer Cell. 2018. PMID: 30537516 Free PMC article.
References
-
- Yao D, Dai C, Peng S. Mechanism of the mesenchymal-epithelial transition and its relationship with metastatic tumor formation. Mol Cancer Res 2011; 9: 1608–1620. - PubMed
-
- Thiery JP, Acloque H, Huang RY, Nieto MA. Epithelial-mesenchymal transitions in development and disease. Cell 2009; 139: 871–890. - PubMed
LinkOut - more resources
Full Text Sources
Other Literature Sources
Research Materials
Miscellaneous
