

Activation of the phospholipid scramblase TMEM16F by nanosecond pulsed electric fields (nsPEF) facilitates its diverse cytophysiological effects
- PMID: 28982976
- PMCID: PMC5702676
- DOI: 10.1074/jbc.M117.803049
Activation of the phospholipid scramblase TMEM16F by nanosecond pulsed electric fields (nsPEF) facilitates its diverse cytophysiological effects
Abstract
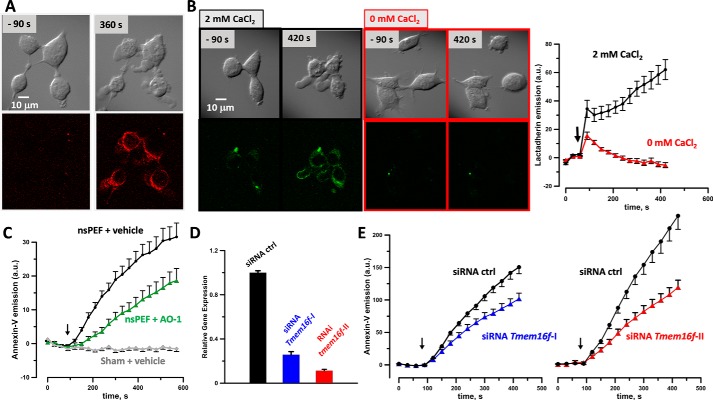
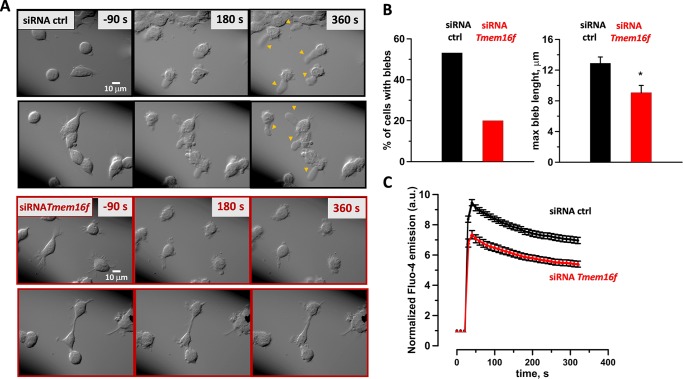
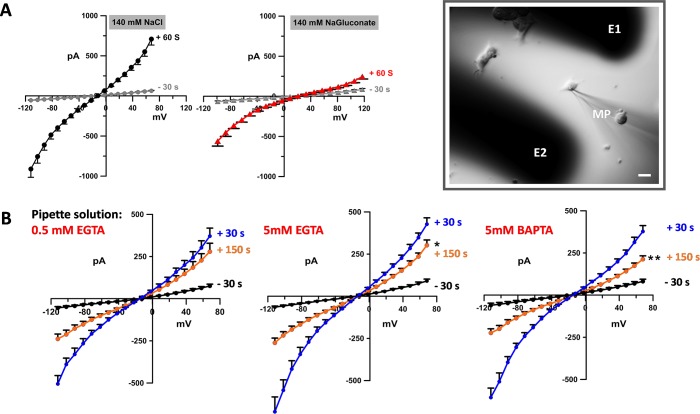
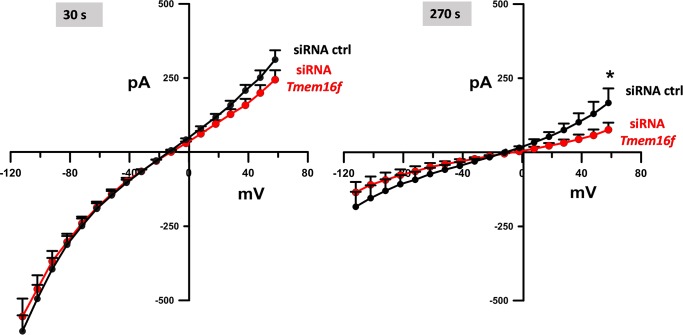
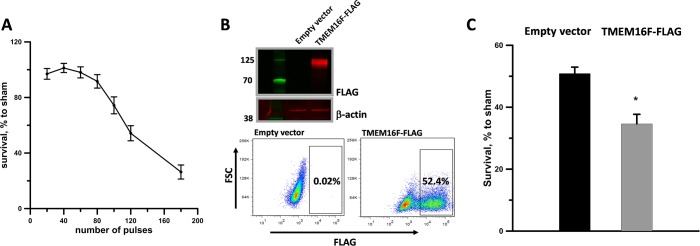
Nanosecond pulsed electric fields (nsPEF) are emerging as a novel modality for cell stimulation and tissue ablation. However, the downstream protein effectors responsible for nsPEF bioeffects remain to be established. Here we demonstrate that nsPEF activate TMEM16F (or Anoctamin 6), a protein functioning as a Ca2+-dependent phospholipid scramblase and Ca2+-activated chloride channel. Using confocal microscopy and patch clamp recordings, we investigated the relevance of TMEM16F activation for several bioeffects triggered by nsPEF, including phosphatidylserine (PS) externalization, nanopore-conducted currents, membrane blebbing, and cell death. In HEK 293 cells treated with a single 300-ns pulse of 25.5 kV/cm, Tmem16f expression knockdown and TMEM16F-specific inhibition decreased nsPEF-induced PS exposure by 49 and 42%, respectively. Moreover, the Tmem16f silencing significantly decreased Ca2+-dependent chloride channel currents activated in response to the nanoporation. Tmem16f expression also affected nsPEF-induced cell blebbing, with only 20% of the silenced cells developing blebs compared with 53% of the control cells. This inhibition of cellular blebbing correlated with a 25% decrease in cytosolic free Ca2+ transient at 30 s after nanoporation. Finally, in TMEM16F-overexpressing cells, a train of 120 pulses (300 ns, 20 Hz, 6 kV/cm) decreased cell survival to 34% compared with 51% in control cells (*, p < 0.01). Taken together, these results indicate that TMEM16F activation by nanoporation mediates and enhances the diverse cellular effects of nsPEF.
Keywords: Anoctamin 6; TMEM16F; cell death; chloride channel; electroporation; nanosecond pulsed electric fields (nsPEF); phosphatidylserine; plasma membrane.
© 2017 by The American Society for Biochemistry and Molecular Biology, Inc.
Conflict of interest statement
The authors declare that they have no conflicts of interest with the contents of this article
Figures
Similar articles
-
Regulation of TMEM16A/ANO1 and TMEM16F/ANO6 ion currents and phospholipid scrambling by Ca2+ and plasma membrane lipid.J Physiol. 2018 Jan 15;596(2):217-229. doi: 10.1113/JP275175. Epub 2017 Dec 18. J Physiol. 2018. PMID: 29134661 Free PMC article.
-
Ion channel and lipid scramblase activity associated with expression of TMEM16F/ANO6 isoforms.J Physiol. 2015 Sep 1;593(17):3829-48. doi: 10.1113/JP270691. Epub 2015 Jul 27. J Physiol. 2015. PMID: 26108457 Free PMC article.
-
Thresholds for phosphatidylserine externalization in Chinese hamster ovarian cells following exposure to nanosecond pulsed electrical fields (nsPEF).PLoS One. 2013 Apr 29;8(4):e63122. doi: 10.1371/journal.pone.0063122. Print 2013. PLoS One. 2013. PMID: 23658665 Free PMC article.
-
Molecular functions of anoctamin 6 (TMEM16F): a chloride channel, cation channel, or phospholipid scramblase?Pflugers Arch. 2014 Mar;466(3):407-14. doi: 10.1007/s00424-013-1305-1. Epub 2013 Jun 8. Pflugers Arch. 2014. PMID: 23748496 Review.
-
Anoctamin pharmacology.Cell Calcium. 2024 Jul;121:102905. doi: 10.1016/j.ceca.2024.102905. Epub 2024 May 10. Cell Calcium. 2024. PMID: 38788257 Review.
Cited by
-
Identification of Proteins Involved in Cell Membrane Permeabilization by Nanosecond Electric Pulses (nsEP).Int J Mol Sci. 2023 May 24;24(11):9191. doi: 10.3390/ijms24119191. Int J Mol Sci. 2023. PMID: 37298142 Free PMC article.
-
Transprotein-Electropore Characterization: A Molecular Dynamics Investigation on Human AQP4.ACS Omega. 2018 Nov 30;3(11):15361-15369. doi: 10.1021/acsomega.8b02230. Epub 2018 Nov 13. ACS Omega. 2018. PMID: 30556005 Free PMC article.
-
Anion and Cation Permeability of the Mouse TMEM16F Calcium-Activated Channel.Int J Mol Sci. 2021 Aug 9;22(16):8578. doi: 10.3390/ijms22168578. Int J Mol Sci. 2021. PMID: 34445284 Free PMC article.
-
Nanosecond pulsed electric field (nsPEF) and vaccines: a novel technique for the inactivation of SARS-CoV-2 and other viruses?Ann Med. 2022 Dec;54(1):1749-1756. doi: 10.1080/07853890.2022.2087898. Ann Med. 2022. PMID: 35786157 Free PMC article.
-
Exploring the Conformational Changes Induced by Nanosecond Pulsed Electric Fields on the Voltage Sensing Domain of a Ca2+ Channel.Membranes (Basel). 2021 Jun 26;11(7):473. doi: 10.3390/membranes11070473. Membranes (Basel). 2021. PMID: 34206827 Free PMC article.
References
-
- Yarmush M. L., Golberg A., Serŝa G., Kotnik T., and Miklavĉiĉ D. (2014) Electroporation-based technologies for medicine: principles, applications, and challenges. Annu. Rev. Biomed. Eng. 16, 295–320 - PubMed
-
- Schoenbach K. S., Hargrave B., Joshi R. P., Kolb J., Osgood C., Nuccitelli R., Pakhomov A. G., Swanson J., Stacey M., White J. A., Xiao S., Zhang J., Beebe S. J., Blackmore P. F., and Buescher E. S. (2007) Bioelectric effects of nanosecond pulses. IEEE Trans. Dielectrics Elec. Insul. 14, 1088–1109
-
- Batista Napotnik T., Wu Y. H., Gundersen M. A., Miklavĉîc D., and Vernier P. T. (2012) Nanosecond electric pulses cause mitochondrial membrane permeabilization in Jurkat cells. Bioelectromagnetics 33, 257–264 - PubMed
Publication types
MeSH terms
Substances
LinkOut - more resources
Full Text Sources
Other Literature Sources
Miscellaneous
