

AKT overactivation can suppress DNA repair via p70S6 kinase-dependent downregulation of MRE11
- PMID: 28967905
- PMCID: PMC5799716
- DOI: 10.1038/onc.2017.340
AKT overactivation can suppress DNA repair via p70S6 kinase-dependent downregulation of MRE11
Abstract
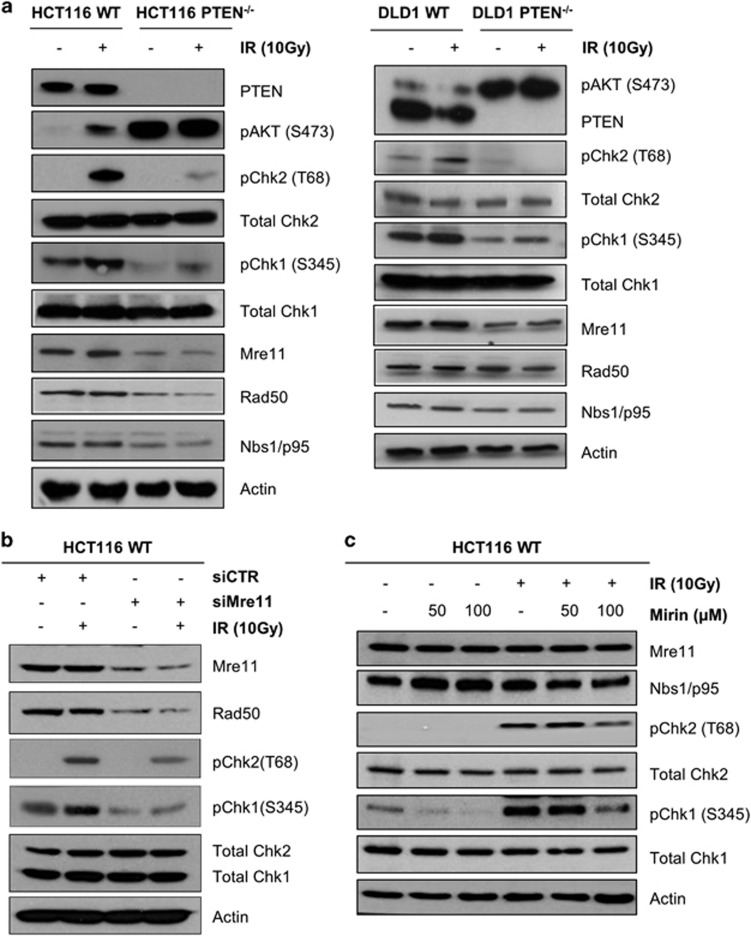
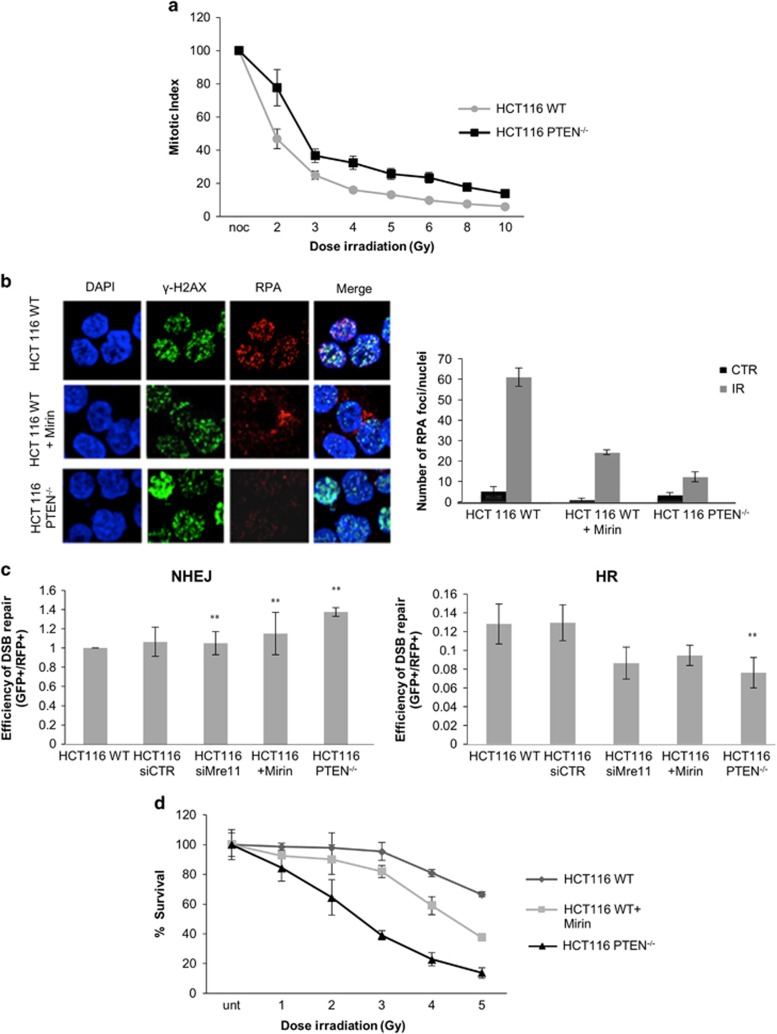
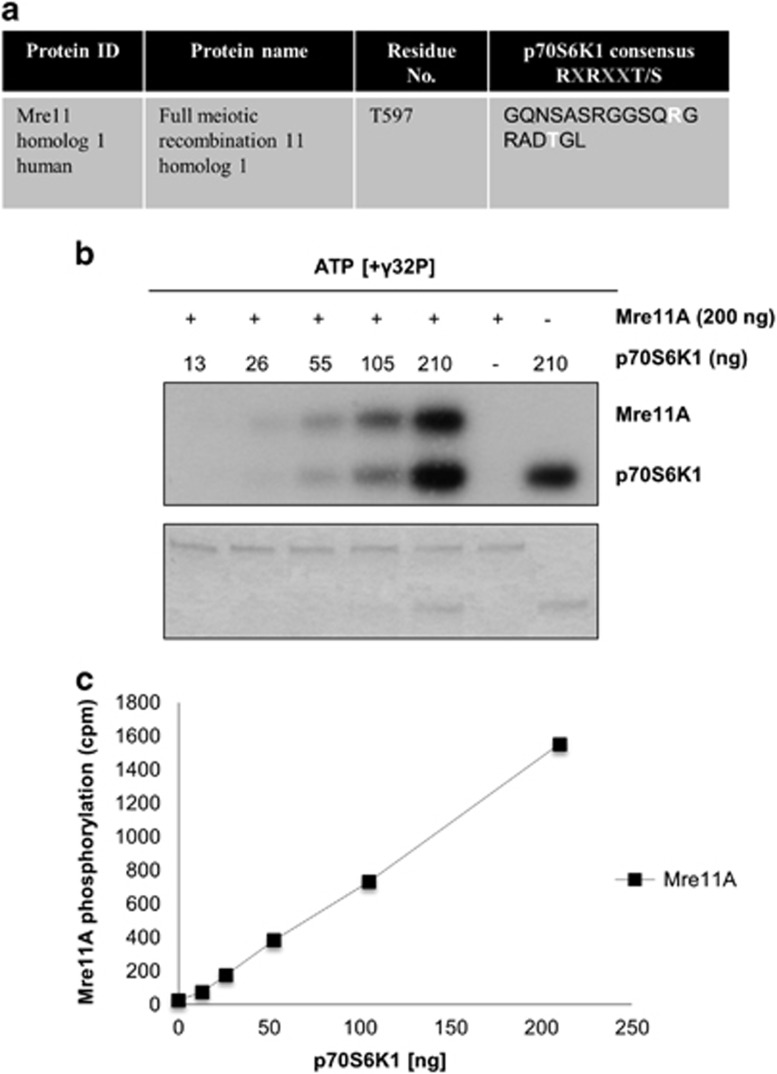
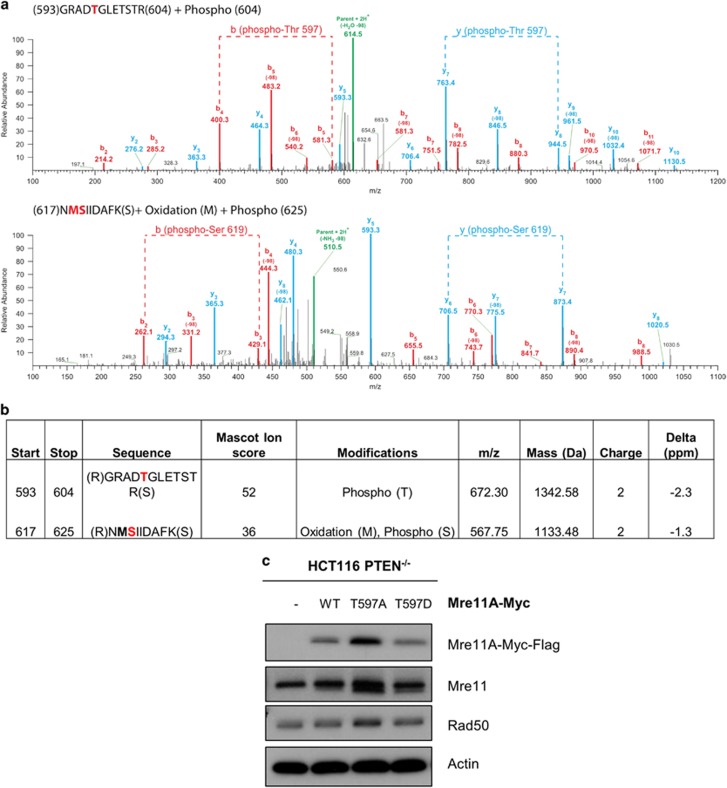
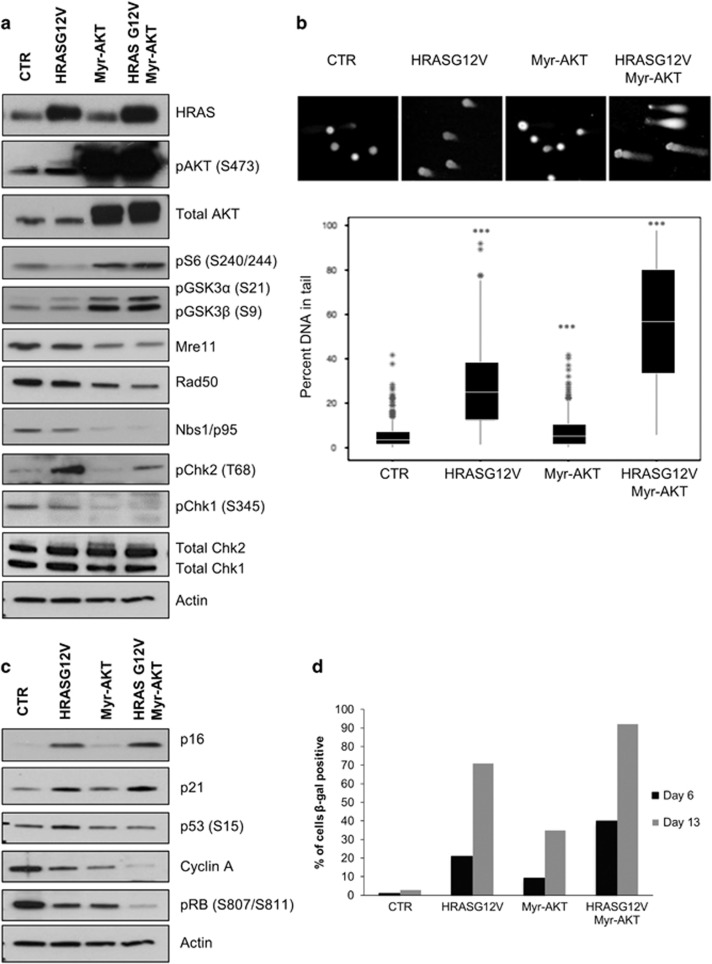
Deregulated AKT kinase activity due to PTEN deficiency in cancer cells contributes to oncogenesis by incompletely understood mechanisms. Here, we show that PTEN deletion in HCT116 and DLD1 colon carcinoma cells leads to suppression of CHK1 and CHK2 activation in response to irradiation, impaired G2 checkpoint proficiency and radiosensitization. These defects are associated with reduced expression of MRE11, RAD50 and NBS1, components of the apical MRE11/RAD50/NBS1 (MRN) DNA damage response complex. Consistent with reduced MRN complex function, PTEN-deficient cells fail to resect DNA double-strand breaks efficiently after irradiation and show greatly diminished proficiency for DNA repair via the error-free homologous recombination (HR) repair pathway. MRE11 is highly unstable in PTEN-deficient cells but stability can be significantly restored by inhibiting mTORC1 or p70S6 kinase (p70S6K), downstream kinases whose activities are stimulated by AKT, or by mutating a residue in MRE11 that we show is phosphorylated by p70S6K in vitro. In primary human fibroblasts, activated AKT suppresses MRN complex expression to escalate RAS-induced DNA damage and thereby reinforce oncogene-induced senescence. Taken together, our data demonstrate that deregulation of the PI3K-AKT/ mTORC1/ p70S6K pathways, an event frequently observed in cancer, exert profound effects on genome stability via MRE11 with potential implications for tumour initiation and therapy.
Conflict of interest statement
The authors declare no conflict of interest.
Figures


Similar articles
-
Defective Mre11-dependent activation of Chk2 by ataxia telangiectasia mutated in colorectal carcinoma cells in response to replication-dependent DNA double strand breaks.J Biol Chem. 2006 Oct 13;281(41):30814-23. doi: 10.1074/jbc.M603747200. Epub 2006 Aug 10. J Biol Chem. 2006. PMID: 16905549
-
MRE11 promotes AKT phosphorylation in direct response to DNA double-strand breaks.Cell Cycle. 2011 Jul 1;10(13):2218-32. doi: 10.4161/cc.10.13.16305. Epub 2011 Jul 1. Cell Cycle. 2011. PMID: 21623170
-
PKB/Akt promotes DSB repair in cancer cells through upregulating Mre11 expression following ionizing radiation.Oncogene. 2011 Feb 24;30(8):944-55. doi: 10.1038/onc.2010.467. Epub 2010 Oct 18. Oncogene. 2011. PMID: 20956948
-
The MRE11 complex: A versatile toolkit for the repair of broken DNA.DNA Repair (Amst). 2020 Jul-Aug;91-92:102869. doi: 10.1016/j.dnarep.2020.102869. Epub 2020 May 15. DNA Repair (Amst). 2020. PMID: 32480356 Review.
-
Discrete signaling mechanisms of mTORC1 and mTORC2: Connected yet apart in cellular and molecular aspects.Adv Biol Regul. 2017 May;64:39-48. doi: 10.1016/j.jbior.2016.12.001. Epub 2017 Jan 4. Adv Biol Regul. 2017. PMID: 28189457 Review.
Cited by
-
Caloric restriction induced epigenetic effects on aging.Front Cell Dev Biol. 2023 Jan 13;10:1079920. doi: 10.3389/fcell.2022.1079920. eCollection 2022. Front Cell Dev Biol. 2023. PMID: 36712965 Free PMC article. Review.
-
Transcriptome analysis of differentially expressed genes and pathways associated with mitoxantrone treatment prostate cancer.J Cell Mol Med. 2019 Mar;23(3):1987-2000. doi: 10.1111/jcmm.14100. Epub 2018 Dec 27. J Cell Mol Med. 2019. PMID: 30592148 Free PMC article.
-
In Vitro Anti-Prostate Cancer Activity of Two Ebselen Analogues.Pharmaceuticals (Basel). 2020 Mar 17;13(3):47. doi: 10.3390/ph13030047. Pharmaceuticals (Basel). 2020. PMID: 32192052 Free PMC article.
-
S6K1 Controls DNA Damage Signaling Modulated by the MRN Complex to Induce Radioresistance in Lung Cancer.Int J Mol Sci. 2024 Sep 28;25(19):10461. doi: 10.3390/ijms251910461. Int J Mol Sci. 2024. PMID: 39408794 Free PMC article.
-
MRE11A Isoform Expression Associated with Outcome Following Radiotherapy in Muscle-Invasive Bladder Cancer does not Alter Cell Survival and DNA Double-Strand Break Repair Following Ionising Radiation.Bladder Cancer. 2019 Aug 16;5(2):147-157. doi: 10.3233/BLC-190209. Bladder Cancer. 2019. PMID: 31942442 Free PMC article.
References
-
- Steck PA, Pershouse MA, Jasser SA, Yung WK, Lin H, Ligon AH et al. Identification of a candidate tumour suppressor gene, MMAC1, at chromosome 10q23.3 that is mutated in multiple advanced cancers. Nat Genet 1997; 15: 356–362. - PubMed
-
- Song MS, Salmena L, Pandolfi PP. The functions and regulation of the PTEN tumour suppressor. Nat Rev Mol Cell Biol 2012; 13: 283–296. - PubMed
-
- Ali SM. Trastuzumab: a viewpoint by Suhail M. Ali. BioDrugs 1999; 12: 136–138. - PubMed
-
- Chow LM, Baker SJ. PTEN function in normal and neoplastic growth. Cancer Lett 2006; 241: 184–196. - PubMed
Publication types
MeSH terms
Substances
Grants and funding
LinkOut - more resources
Full Text Sources
Other Literature Sources
Molecular Biology Databases
Research Materials
Miscellaneous
