

Similar Evolutionary Trajectories for Retrotransposon Accumulation in Mammals
- PMID: 28945883
- PMCID: PMC5610350
- DOI: 10.1093/gbe/evx179
Similar Evolutionary Trajectories for Retrotransposon Accumulation in Mammals
Abstract
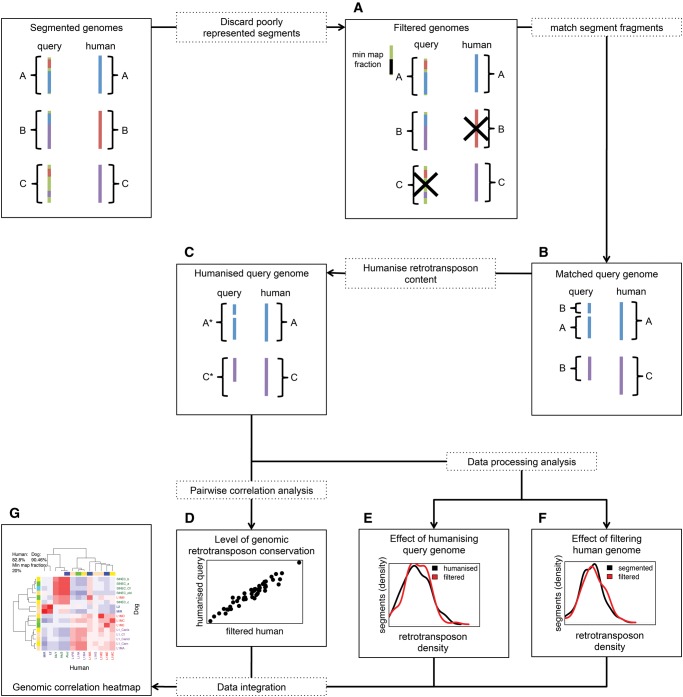
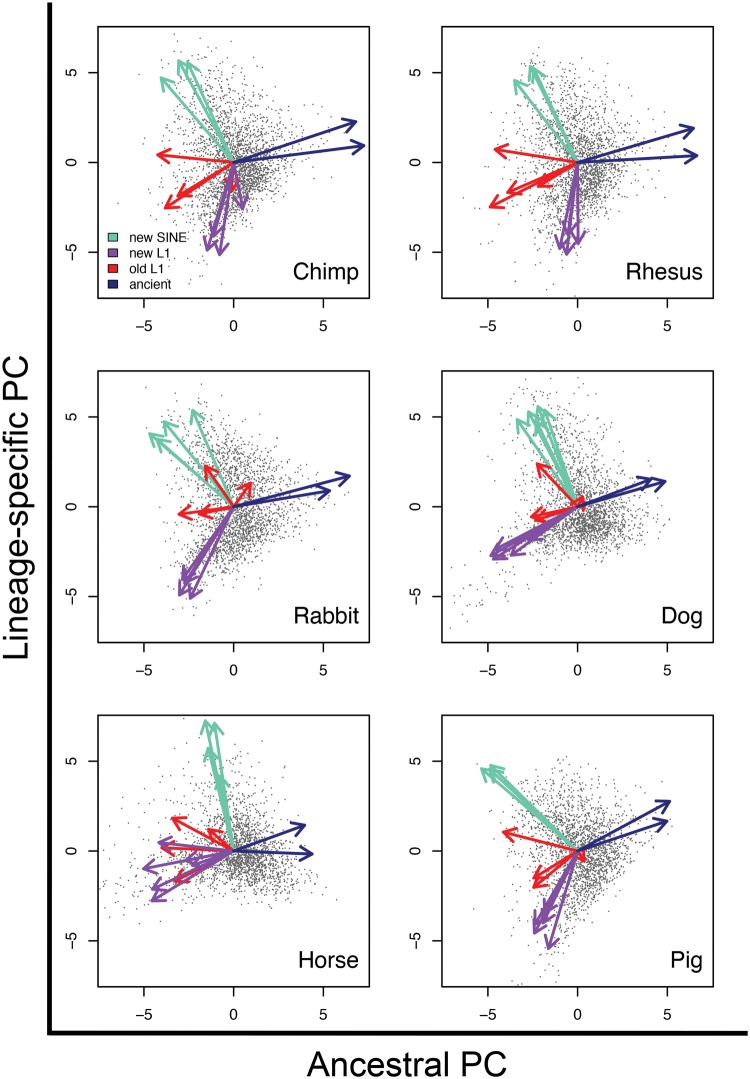
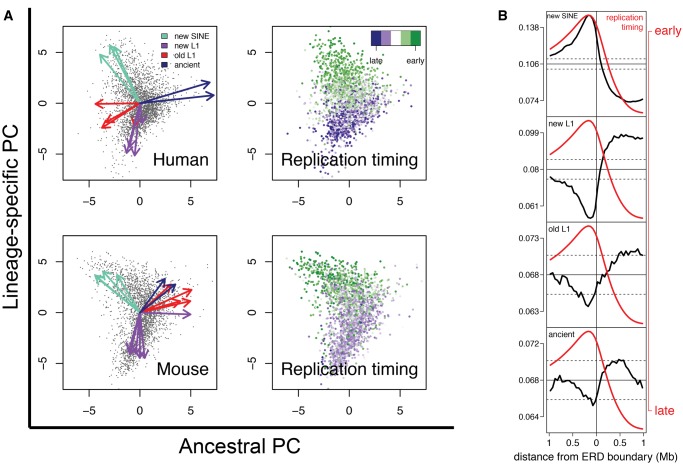
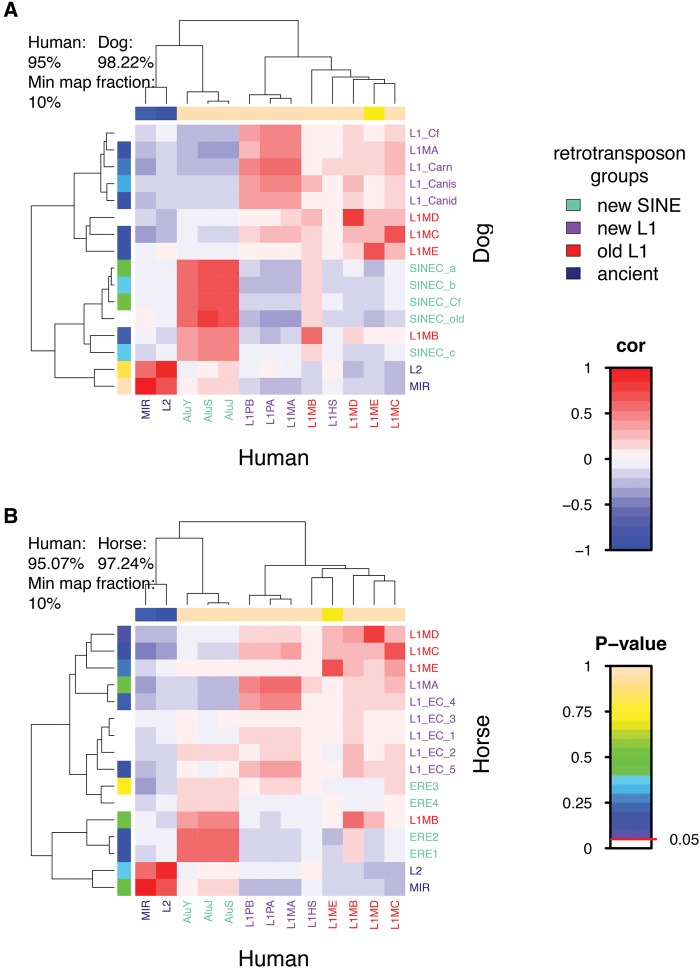
The factors guiding retrotransposon insertion site preference are not well understood. Different types of retrotransposons share common replication machinery and yet occupy distinct genomic domains. Autonomous long interspersed elements accumulate in gene-poor domains and their nonautonomous short interspersed elements accumulate in gene-rich domains. To determine genomic factors that contribute to this discrepancy we analyzed the distribution of retrotransposons within the framework of chromosomal domains and regulatory elements. Using comparative genomics, we identified large-scale conserved patterns of retrotransposon accumulation across several mammalian genomes. Importantly, retrotransposons that were active after our sample-species diverged accumulated in orthologous regions. This suggested a similar evolutionary interaction between retrotransposon activity and conserved genome architecture across our species. In addition, we found that retrotransposons accumulated at regulatory element boundaries in open chromatin, where accumulation of particular retrotransposon types depended on insertion size and local regulatory element density. From our results, we propose a model where density and distribution of genes and regulatory elements canalize retrotransposon accumulation. Through conservation of synteny, gene regulation and nuclear organization, mammalian genomes with dissimilar retrotransposons follow similar evolutionary trajectories.
Keywords: genome architecture; genome evolution; transposable element.
© The Author 2017. Published by Oxford University Press on behalf of the Society for Molecular Biology and Evolution.
Figures


Similar articles
-
Chromosomal distribution and evolution of abundant retrotransposons in plants: gypsy elements in diploid and polyploid Brachiaria forage grasses.Chromosome Res. 2015 Sep;23(3):571-82. doi: 10.1007/s10577-015-9492-6. Chromosome Res. 2015. PMID: 26386563
-
Replication of nonautonomous retroelements in soybean appears to be both recent and common.Plant Physiol. 2008 Dec;148(4):1760-71. doi: 10.1104/pp.108.127910. Epub 2008 Oct 24. Plant Physiol. 2008. PMID: 18952860 Free PMC article.
-
MIR retrotransposon sequences provide insulators to the human genome.Proc Natl Acad Sci U S A. 2015 Aug 11;112(32):E4428-37. doi: 10.1073/pnas.1507253112. Epub 2015 Jul 27. Proc Natl Acad Sci U S A. 2015. PMID: 26216945 Free PMC article.
-
Transposable elements as genetic accelerators of evolution: contribution to genome size, gene regulatory network rewiring and morphological innovation.Genes Genet Syst. 2020 Jan 30;94(6):269-281. doi: 10.1266/ggs.19-00029. Epub 2020 Jan 10. Genes Genet Syst. 2020. PMID: 31932541 Review.
-
Evolutionary forces generating sequence homogeneity and heterogeneity within retrotransposon families.Cytogenet Genome Res. 2005;110(1-4):383-91. doi: 10.1159/000084970. Cytogenet Genome Res. 2005. PMID: 16093690 Review.
Cited by
-
Widespread HCD-tRNA derived SINEs in bivalves rely on multiple LINE partners and accumulate in genic regions.Mob DNA. 2024 Oct 16;15(1):22. doi: 10.1186/s13100-024-00332-x. Mob DNA. 2024. PMID: 39415259 Free PMC article.
-
Impact of non-LTR retrotransposons in the differentiation and evolution of anatomically modern humans.Mob DNA. 2018 Aug 15;9:28. doi: 10.1186/s13100-018-0133-4. eCollection 2018. Mob DNA. 2018. PMID: 30147753 Free PMC article.
-
Retrotransposon-induced mosaicism in the neural genome.Open Biol. 2018 Jul;8(7):180074. doi: 10.1098/rsob.180074. Open Biol. 2018. PMID: 30021882 Free PMC article. Review.
-
A highly contiguous genome assembly for the pocket mouse Perognathus longimembris longimembris.J Hered. 2024 Feb 3;115(1):130-138. doi: 10.1093/jhered/esad060. J Hered. 2024. PMID: 37793045 Free PMC article.
-
Divergent genome evolution caused by regional variation in DNA gain and loss between human and mouse.PLoS Comput Biol. 2018 Apr 20;14(4):e1006091. doi: 10.1371/journal.pcbi.1006091. eCollection 2018 Apr. PLoS Comput Biol. 2018. PMID: 29677183 Free PMC article.
References
MeSH terms
Substances
LinkOut - more resources
Full Text Sources
Other Literature Sources
