. 2017 Nov 6;216(11):3695-3712.
doi: 10.1083/jcb.201703015. Epub 2017 Sep 21.

Sequence-dependent cargo recognition by SNX-BARs mediates retromer-independent transport of CI-MPR

Affiliations

Sequence-dependent cargo recognition by SNX-BARs mediates retromer-independent transport of CI-MPR

Boris Simonetti et al. J Cell Biol. .

Abstract

Endosomal recycling of transmembrane proteins requires sequence-dependent recognition of motifs present within their intracellular cytosolic domains. In this study, we have reexamined the role of retromer in the sequence-dependent endosome-to-trans-Golgi network (TGN) transport of the cation-independent mannose 6-phosphate receptor (CI-MPR). Although the knockdown or knockout of retromer does not perturb CI-MPR transport, the targeting of the retromer-linked sorting nexin (SNX)-Bin, Amphiphysin, and Rvs (BAR) proteins leads to a pronounced defect in CI-MPR endosome-to-TGN transport. The retromer-linked SNX-BAR proteins comprise heterodimeric combinations of SNX1 or SNX2 with SNX5 or SNX6 and serve to regulate the biogenesis of tubular endosomal sorting profiles. We establish that SNX5 and SNX6 associate with the CI-MPR through recognition of a specific WLM endosome-to-TGN sorting motif. From validating the CI-MPR dependency of SNX1/2-SNX5/6 tubular profile formation, we provide a mechanism for coupling sequence-dependent cargo recognition with the biogenesis of tubular profiles required for endosome-to-TGN transport. Therefore, the data presented in this study reappraise retromer's role in CI-MPR transport.


Figures

Figure 1.
Figure 1.
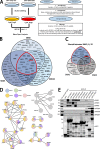
Interactome of the retromer-linked SNX-BAR complex. (A) Schematic representation of the SILAC methodology and the approach used to filter and merge SILAC datasets. (B) Venn diagram showing the interactors of SNX5, SNX6, and SNX32. (C) Venn diagram showing the interactors of SNX1 and SNX2 together with the shared interactors between SNX5, SNX6, and SNX32 (those within the red demarcated area in B). (D) STRING analysis of SNX-BAR interactors. Interactors were compiled and subjected to STRING analysis. Each connecting line represents an interaction indicated by experimental or database evidence. Color of the node indicates presence of the protein in a specific subset of the SNX-BAR interactome. (E) GFP trap of GFP-tagged retromer-linked SNX-BARs, retromer, and the retromer-independent SNX4 and SNX8, each transiently transfected in HEK293T cells. Molecular masses are given in kilodaltons. IP, immunoprecipitation.
Figure 2.
Figure 2.
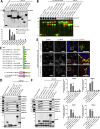
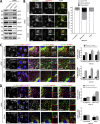
SNX5, SNX6, and SNX32 interact with the CI-MPR tail via the WLM sorting motif. (A) Consistent with SILAC-based proteomics, GFP-tagged SNX5, SNX6, and SNX32 but not SNX1, SNX2, or retromer immunoprecipitate (IP) CI-MPR in a GFP-trap experiment. Under the blots is a summary of CI-MPR binding ability from quantitative fluorescence-based Western blotting and SILAC-based enrichment and peptide counts. (B) Coexpression of heterodimeric combinations of GFP-tagged and mCherry-tagged SNX1–SNX5 and SNX2–SNX5 in HEK293T cells. GFP trap of GFP-SNX1 and GFP-SNX2 revealed an enhanced association with CI-MPR when the formation of SNX1–SNX5 and SNX2–SNX5 was favored by coexpression of the binding partner SNX5. (C) Summary of constructs used. Retrograde sorting motifs in brackets correspond with the black boxed regions. (D) GFP trap of GFP-tagged cargo tails transiently transfected in HEK293T cells showing that of the tails’ constructs; only CI-MPR pulls down the retromer-linked SNX-BARs but little, if any, of the retromer. SNX30 was used as a negative control. (E) The WLM motif within the tail of CI-MPR is an endosome-to-TGN sorting motif. HeLa cells were cotransfected with CRISPR-Cas9 plasmids against CI-MPR and a puromycin resistance–expressing plasmid before puromycin selection 24 h later. Cells were then transfected with full-length (FL) CI-MPR or full-length CI-MPR WLM-AAA. 48 h after transfection, cells were incubated with an antibody targeting the CI-MPR extracellular domain, and its trafficking was analyzed after 40 min. Zoomed images on right are marked by boxes in main images. Bars: (main images) 20 µm; (zooms) 10 µm. (F) The CI-MPR WLM sorting motif is necessary for interaction with the retromer-linked SNX-BARs. Summary of CI-MPR mutant binding ability from quantitative fluorescence–based Western blotting. SNX30 was used as negative control. n = 3 independent experiments (means ± SEM; one-way ANOVA compared with GFP–CI-MPR tail 1–164. *, P < 0.05; **, P < 0.01; ***, P < 0.001; ****, P < 0.0001).
Figure 3.
Figure 3.
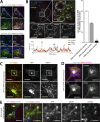
CI-MPR segregates in SNX1/2–SNX5/6 tubular profiles which are not decorated with retromer. (A) Endogenous CI-MPR localizes to a highly packed vesicular cluster that colocalized with the TGN and partially colocalized with retromer-positive endosomes. HeLa cells were fixed and immunostained for endogenous TGN46 (TGN marker), VPS35 (retromer), SNX1, and SNX2 (both retromer-linked SNX-BARs). Bars: (main images) 20 µm; (zooms) 5 µm. (B, top) CI-MPR colocalizes with SNX2-positive subdomains on enlarged endosomes. HeLa cells were transfected with BFP-Rab5Q79L and immunostained for endogenous CI-MPR, SNX2, and VPS35 after 48 h. The dashed line in the top left image indicates the contour of the nucleus, and the dashed line on the top right refers to the enlarged endosome from which the intensity line scan was measured. Bars: (main images) 10 µm; (zooms) 5 µm. (B, bottom) Line scan of signal intensity across the circumference of enlarged endosome. (B, right) Distribution of CI-MPR in retromer subdomains; n = 3 independent experiments. CI-MPR signal was quantified in 36 enlarged endosomes (means ± SEM). (C) Overexpression of a WT GFP–CI-MPR chimera leads to the formation of extended CI-MPR tubules, some of which are positive for endogenous SNX1. HeLa cells were transfected with GFP–CI-MPR chimera WT and immunostained for SNX1 after 48 h. Bars: (main images) 20 µm; (zooms) 10 µm. (D) A subpopulation of GFP–CI-MPR chimera tubules is decorated with endogenous SNX1 but not endogenous VPS35. HeLa cells were transfected with GFP–CI-MPR chimera WT and immunostained for SNX1 and VPS35 after 48 h. Bars, 20 µm. (E) Some SNX1/2–SNX5/6-decorated CI-MPR–containing tubules were observed to emanate from VPS35-positive endosomes. HeLa cells were transfected with GFP–CI-MPR chimera WT and immunostained for SNX6 and VPS35 after 48 h. The box in the leftmost panel indicates the area depicted in the other four panels. Bars: (main images) 20 µm; (zooms) 2 µm.
Figure 4.
Figure 4.
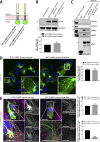
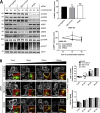
SNX1 is less efficiently recruited to CI-MPR tubules expressing a chimera harboring the WLM-AAA mutation. (A) Scheme of CI-MPR chimera constructs used. SP, signal peptide; TM, transmembrane domain. (B, top) The GFP–CI-MPR chimera WT and the GFP–CI-MPR chimera WLM-AAA mutant have comparable expression levels. HeLa cells were transfected with CI-MPR chimeras. 48 h after transfection, GFP levels were analyzed by Western blotting. (B, bottom) n = 3 independent experiments. (C) The GFP–CI-MPR chimera WLM-AAA mutant has a reduced ability to bind to the SNX1/2–SNX5/6 complex. GFP trap of GFP-tagged GFP–CI-MPR chimeras, each transiently transfected in HEK293T cells. Molecular masses are given in kilodaltons. IP, immunoprecipitation. (D, left) HeLa cells were transfected with WT or WLM-AAA mutant GFP–CI-MPR chimera constructs. Bars: (main images) 20 µm; (insets) 5 µm. (D, right) The percentages of cells with at least one GFP-positive tubule were blindly scored. n = 3 independent experiments; WT, 145 cells; WLM-AAA, 139 cells. (E) HeLa cells were transfected with WT or WLM-AAA mutant GFP–CI-MPR construct and immunostained for endogenous SNX1 and endogenous VPS35 after 48 h. Bars: (main images) 20 µm; (insets) 10 µm. (E, top right) Relative number of GFP-positive and SNX1-negative tubules per cell. n = 3 blindly scored independent experiments; WT, 40 cells; WLM-AAA, 38 cells. (E, bottom right) Relative number of GFP-positive and SNX1-positive tubules per cell. n = 3 blindly scored independent experiments; WT, 40 cells; WLM-AAA, 38 cells (means ± SEM; unpaired t test; *, P < 0.05; ***, P < 0.001). The total number of tubules analyzed in WT cells was 254 tubules and in WLM-AAA cells was 199 tubules.
Figure 5.
Figure 5.
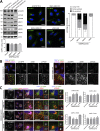
Loss of the SNX1/2–SNX5/6 complex leads to an accumulation of CI-MPR in endosomes. (A) HeLa cells were transiently transfected with nontargeting siRNA, siRNA targeting VPS35 or an siRNA pool against SNX1, SNX2, SNX5, and SNX6. 72 h after transfection, endogenous protein levels were analyzed by Western blotting. (B) CI-MPR steady-state localization in retromer versus retromer-linked SNX-BAR–knockdown cells. Representative images (left) and blind scoring and quantification (right) of the percentage of cells displaying each phenotype in knockdown conditions. n = 3 independent experiments; nontargeting, 144 cells; SNX1+2+5+6, 169 cells; VPS35, 133 cells. (C) Immunofluorescence and colocalization analysis of endogenous CI-MPR and lysosomal marker LAMP1 and early endosomal marker EEA1 in SNX1, SNX2, SNX5, and SNX6 or VPS35-knockdown HeLa cells. (C, top right) n = 3 independent experiments; nontargeting, 130 cells; SNX1+2+5+6, 162 cells; VPS35, 103 cells. (C, bottom right) n = 3 independent experiments; nontargeting, 115 cells; SNX1+2+5+6, 131 cells; VPS35, 109 cells. (D) Immunofluorescence and colocalization analysis of endogenous CI-MPR and transition endosome markers SNX1 and VPS35 in SNX1, SNX2, SNX5, and SNX6 or VPS35-deficient HeLa cells. Bars: (main images) 20 µm; (insets) 5 µm. (D, top right) n = 3 independent experiments; nontargeting, 101 cells; SNX1+2+5+6, 100 cells. (D, bottom right) n = 3 independent experiments; nontargeting, 98 cells; VPS35, 119 cells (means ± SEM; two-way ANOVA compared with nontargeting control; *, P < 0.05; **, P < 0.01).
Figure 6.
Figure 6.
Loss of the SNX1/2–SNX5/6 complex leads to a pronounced retrograde sorting defect of the CI-MPR. (A) Degradation assay of endogenous CI-MPR. HeLa cells were transfected with nontargeting siRNA, siRNA against VPS35, or a pool of siRNAs against SNX1, SNX2, SNX5, and SNX6. 72 h after transfection, cells were incubated with 10 µg/ml cycloheximide and lysed at different time points as indicated. The level of endogenous CI-MPR was analyzed by quantitative Western blotting. Molecular masses are given in kilodaltons. (A, top right) n = 4 independent experiments (one-way ANOVA compared with nontargeting control). (A, bottom right) n = 4 independent experiments (two-way ANOVA compared with nontargeting control). (B) CI-MPR–CD8 uptake assays in retromer and retromer-linked SNX-BAR–knockdown cells show a retrograde trafficking defect only in SNX1/2–SNX5/6–depleted cells. HeLa cells were transfected with nontargeting siRNA, siRNA against VPS35, or a pool of siRNAs against SNX1, SNX2, SNX5, and SNX6. 72 h after transfection, cells were incubated with αCD8 antibody, and its trafficking was followed for 60 min. The retrograde transport to the TGN was assayed through measuring colocalization of CD8 signal with the TGN marker TGN46. n = 3 independent experiments; 0 min, ≥72 cells per condition; 10 min, ≥74 cells per condition; 20 min, ≥78 cells per condition; 60 min, ≥69 cells per condition (means ± SEM; two-way ANOVA compared with nontargeting control; *, P < 0.05; **, P < 0.01; ****, P < 0.0001). Bars: (main images) 20 µm; (insets) 5 µm.
Figure 7.
Figure 7.
Gene editing confirms the essential role of SNX1/2–SNX5/6 in endosome-to-TGN recycling of CI-MPR. (A, left) CI-MPR levels and CI-MPR steady-state localization in retromer and SNX1/2–SNX5/6 KO cells. HeLa cells were transfected with CRISPR-Cas9 plasmids against SNX1 and SNX2, SNX5 and SNX6, or VPS35. 96 h after transfection, endogenous protein levels were analyzed by Western blotting, and cells were fixed and stained for endogenous CI-MPR. n = 3 independent experiments (one-way ANOVA compared with parental HeLa). Molecular masses are given in kilodaltons. (A, middle) Representative images. Bars, 20 µm. (A, right) quantification of the percentage of cells displaying each phenotype. n = 3 blindly scored independent experiments; parental, 116 cells; VPS35, 106 cells; SNX5 + SNX6, 111 cells; VPS35, 106 cells. (B) Immunofluorescence of endogenous CI-MPR and endogenous SNX1 and VPS35 in retromer KO cells and SNX1 and SNX2 KO cells. Bars: (top) 20 µm; (bottom) 5 µm. (C) Immunofluorescence and colocalization analysis of endogenous CI-MPR and TGN marker TGN46 and early endosomal marker EEA1 in SNX1 and SNX2, SNX5 and SNX6, and VPS35 CRISPR-Cas9 KO HeLa cells. Bars: (main images) 20 µm; (insets) 10 µm. (C, top right) n = 3 independent experiments; parental HeLa, 80 cells; SNX1+2 KO, 99 cells; SNX5+6, 81 cells; VPS35 KO, 76 cells. (C, bottom right) n = 4 independent experiments; parental HeLa, 102 cells, SNX1+2 KO, 114 cells; SNX5+6, 104 cells; VPS35 KO, 102 cells (means ± SEM; one-way ANOVA compared with parental HeLa; *, P < 0.05; **, P < 0.01).
Figure 8.
Figure 8.
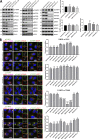
Clonal HeLa KO cell lines recapitulate the SNX1/2–SNX5/6 mediated retromer-independent retrograde transport of CI-MPR. (A) Clonal cell lines were isolated from a heterogeneous population of CRISPR-Cas9 KO. Two independent lines were biochemically characterized as SNX1+2 KOs, two as SNX5+6 KOs, two as VPS35 KOs, and three as parental clonal lines. Molecular masses are given in kilodaltons. (A, right) CI-MPR levels were analyzed by Western blotting. n = 3 independent experiments. (B, left) Immunofluorescence and colocalization analysis of endogenous CI-MPR, TGN marker TGN46, and early endosomal marker EEA1 in parental HeLa and clonally selected KO lines. Bars, 20 µm. (B, top right two graphs) n = 3 independent experiments; parental HeLa, 58 cells; parental c8, 79 cells; parental c21, 81 cells; SNX1+2 KO c4, 75 cells; SNX1+2 KO c16, 70 cells; SNX5+6 KO c13, 82 cells; SNX5+6 KO c18, 89 cells; VPS35 KO c5, 83 cells; VPS35 KO c7, 72 cells. (B, bottom right two graphs) n = 3 independent experiments; parental HeLa, 67 cells; parental c8, 72 cells; parental c21, 87 cells; SNX1+2 KO c4, 83 cells; SNX1+2 KO c16, 80 cells; SNX5+6 KO c13, 84 cells; SNX5+6 KO c18, 98 cells; VPS35 KO c5, 73 cells; VPS35 KO c7, 68 cells (means ± SEM; one-way ANOVA compared with parental HeLa. *, P < 0.05; **, P < 0.01; ***, P < 0.001; ****, P < 0.001).
Figure 9.
Figure 9.
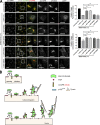
Reexpression of GFP-tagged SNX5 or SNX6 rescues the normal steady-state distribution of CI-MPR in the SNX5+6 KO c13 clonal line. (A) The SNX5+6 KO clonal line c13 was lentivirally transduced with GFP-SNX5, GFP-SNX6, GFP-SNX4, GFP-SNX8, or GFP alone. Colocalization analysis of endogenous CI-MPR and TGN marker TGN46 allowed comparison of CI-MPR distribution between the transduced lines and parental HeLa. Bars: (main images) 40 µm; (zooms) 20 µm. (A, right) n = 3 independent experiments; parental HeLa, 63 cells; +GFP, 70 cells; +SNX5, 72 cells; +SNX6, 78 cells; +SNX8, 66 cells; +SNX4, 73 cells (means ± SEM; one-way ANOVA compared with +GFP. ***, P < 0.001). (B) A schematic for how the SNX1/2–SNX5/6 complex coordinates sequence-dependent cargo recognition of the CI-MPR with the biogenesis of tubular-based cargo-enriched transport carriers.

Comment in

Similar articles

Cited by

References

    1. Arighi C.N., Hartnell L.M., Aguilar R.C., Haft C.R., and Bonifacino J.S.. 2004. Role of the mammalian retromer in sorting of the cation-independent mannose 6-phosphate receptor. J. Cell Biol. 165:123–133. 10.1083/jcb.200312055 - DOI - PMC - PubMed
    1. Barbieri M.A., Li G., Mayorga L.S., and Stahl P.D.. 1996. Characterization of Rab5:Q79L-stimulated endosome fusion. Arch. Biochem. Biophys. 326:64–72. 10.1006/abbi.1996.0047 - DOI - PubMed
    1. Bean B.D., Davey M., and Conibear E.. 2017. Cargo selectivity of yeast sorting nexins. Traffic. 18:110–122. 10.1111/tra.12459 - DOI - PubMed
    1. Burd C., and Cullen P.J.. 2014. Retromer: a master conductor of endosome sorting. Cold Spring Harb. Perspect. Biol. 6:a016774 10.1101/cshperspect.a016774 - DOI - PMC - PubMed
    1. Carlton J., Bujny M., Peter B.J., Oorschot V.M., Rutherford A., Mellor H., Klumperman J., McMahon H.T., and Cullen P.J.. 2004. Sorting nexin-1 mediates tubular endosome-to-TGN transport through coincidence sensing of high- curvature membranes and 3-phosphoinositides. Curr. Biol. 14:1791–1800. 10.1016/j.cub.2004.09.077 - DOI - PubMed

Publication types

MeSH terms