

Molecular characterization of the transition from acute to chronic kidney injury following ischemia/reperfusion
- PMID: 28931758
- PMCID: PMC5612583
- DOI: 10.1172/jci.insight.94716
Molecular characterization of the transition from acute to chronic kidney injury following ischemia/reperfusion
Abstract
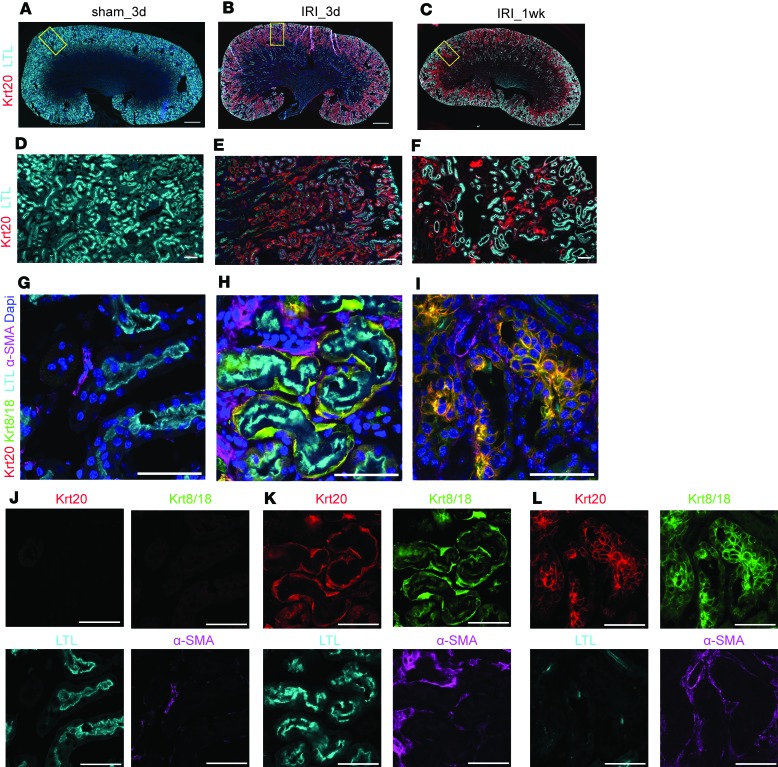
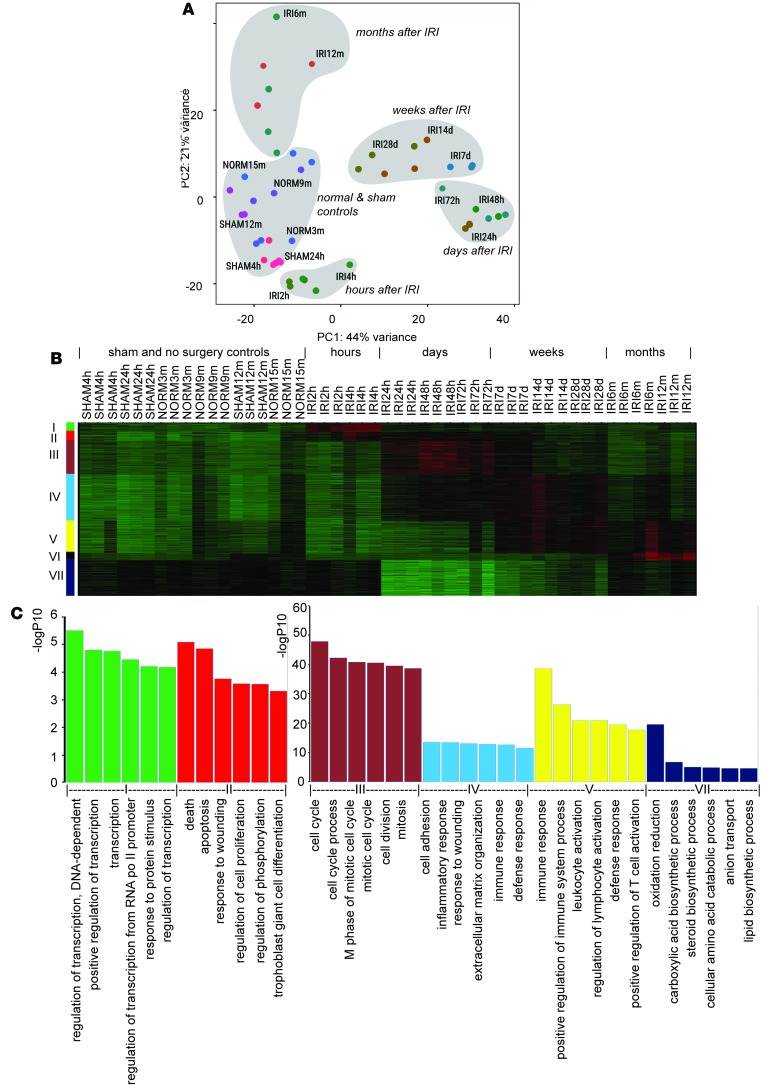
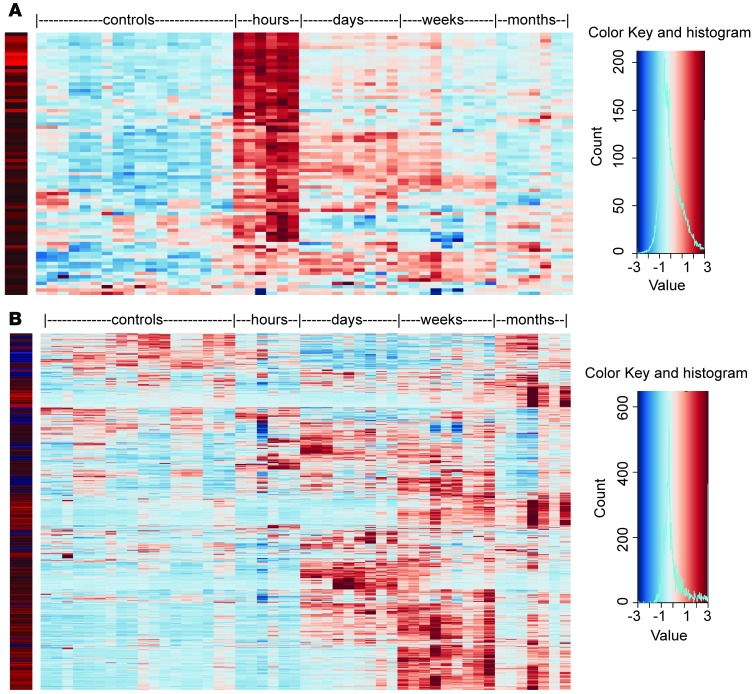
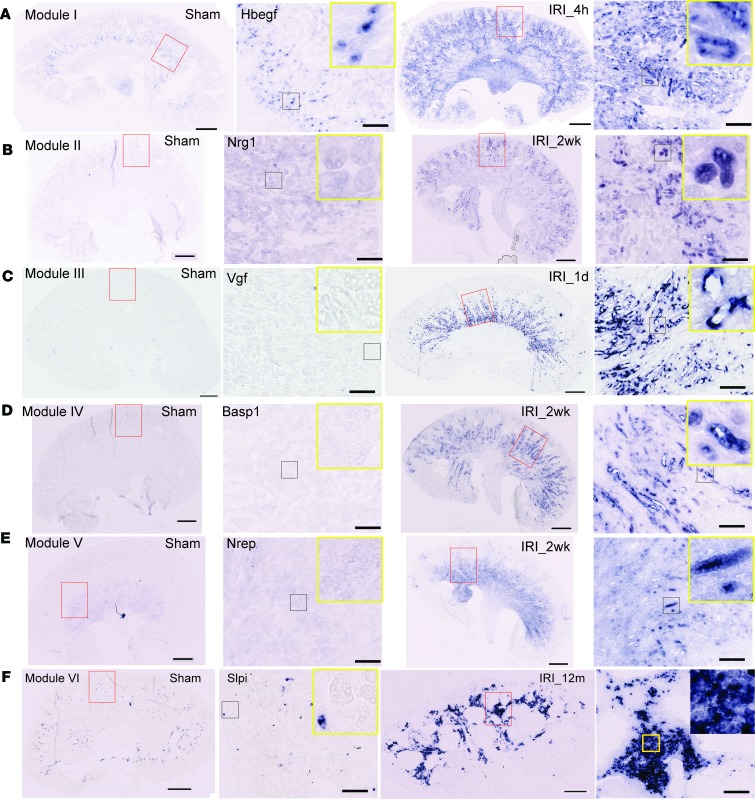
Though an acute kidney injury (AKI) episode is associated with an increased risk of chronic kidney disease (CKD), the mechanisms determining the transition from acute to irreversible chronic injury are not well understood. To extend our understanding of renal repair, and its limits, we performed a detailed molecular characterization of a murine ischemia/reperfusion injury (IRI) model for 12 months after injury. Together, the data comprising RNA-sequencing (RNA-seq) analysis at multiple time points, histological studies, and molecular and cellular characterization of targeted gene activity provide a comprehensive profile of injury, repair, and long-term maladaptive responses following IRI. Tubular atrophy, interstitial fibrosis, inflammation, and development of multiple renal cysts were major long-term outcomes of IRI. Progressive proximal tubular injury tracks with de novo activation of multiple Krt genes, including Krt20, a biomarker of renal tubule injury. RNA-seq analysis highlights a cascade of temporal-specific gene expression patterns related to tubular injury/repair, fibrosis, and innate and adaptive immunity. Intersection of these data with human kidney transplant expression profiles identified overlapping gene expression signatures correlating with different stages of the murine IRI response. The comprehensive characterization of incomplete recovery after ischemic AKI provides a valuable resource for determining the underlying pathophysiology of human CKD.
Keywords: Molecular diagnosis; Mouse models; Nephrology.
Conflict of interest statement
Figures

Similar articles
-
ISG15 accelerates acute kidney injury and the subsequent AKI-to-CKD transition by promoting TGFβR1 ISGylation.Theranostics. 2024 Jul 22;14(11):4536-4553. doi: 10.7150/thno.95796. eCollection 2024. Theranostics. 2024. PMID: 39113797 Free PMC article.
-
A short treatment with resveratrol after a renal ischaemia-reperfusion injury prevents maladaptive repair and long-term chronic kidney disease in rats.J Physiol. 2024 Apr;602(8):1835-1852. doi: 10.1113/JP285979. Epub 2024 Mar 26. J Physiol. 2024. PMID: 38529522
-
Cellular communication network factor 2 (CCN2) promotes the progression of acute kidney injury to chronic kidney disease.Biochem Biophys Res Commun. 2019 Sep 10;517(1):96-102. doi: 10.1016/j.bbrc.2019.07.024. Epub 2019 Jul 15. Biochem Biophys Res Commun. 2019. PMID: 31320136
-
Metabolic Flexibility and Innate Immunity in Renal Ischemia Reperfusion Injury: The Fine Balance Between Adaptive Repair and Tissue Degeneration.Front Immunol. 2020 Jul 7;11:1346. doi: 10.3389/fimmu.2020.01346. eCollection 2020. Front Immunol. 2020. PMID: 32733450 Free PMC article. Review.
-
Rodent models of AKI-CKD transition.Am J Physiol Renal Physiol. 2018 Oct 1;315(4):F1098-F1106. doi: 10.1152/ajprenal.00199.2018. Epub 2018 Jun 27. Am J Physiol Renal Physiol. 2018. PMID: 29949392 Free PMC article. Review.
Cited by
-
Ascorbate protects human kidney organoids from damage induced by cell-free hemoglobin.Dis Model Mech. 2023 Dec 1;16(12):dmm050342. doi: 10.1242/dmm.050342. Epub 2023 Dec 1. Dis Model Mech. 2023. PMID: 37942584 Free PMC article.
-
Spatial transcriptomics defines injury specific microenvironments and cellular interactions in kidney regeneration and disease.Nat Commun. 2024 Sep 5;15(1):7010. doi: 10.1038/s41467-024-51186-z. Nat Commun. 2024. PMID: 39237549 Free PMC article.
-
Profibrotic role of the SOX9-MMP10-ECM biosynthesis axis in the tracheal fibrosis after injury and repair.Genes Dis. 2023 Jul 15;11(5):101040. doi: 10.1016/j.gendis.2023.06.012. eCollection 2024 Sep. Genes Dis. 2023. PMID: 38993791 Free PMC article.
-
Chromatin accessibility dynamics dictate renal tubular epithelial cell response to injury.Nat Commun. 2022 Nov 28;13(1):7322. doi: 10.1038/s41467-022-34854-w. Nat Commun. 2022. PMID: 36443310 Free PMC article.
-
Recent Approaches to Targeting Canonical NFκB Signaling in the Early Inflammatory Response to Renal IRI.J Am Soc Nephrol. 2021 Sep;32(9):2117-2124. doi: 10.1681/ASN.2021010069. Epub 2021 Jun 9. J Am Soc Nephrol. 2021. PMID: 34108233 Free PMC article. Review.
References
Publication types
MeSH terms
Substances
Grants and funding
LinkOut - more resources
Full Text Sources
Other Literature Sources
Medical
Molecular Biology Databases
Research Materials
