. 2017 Nov 6;216(11):3745-3765.
doi: 10.1083/jcb.201704061. Epub 2017 Sep 18.

Control of actin polymerization via the coincidence of phosphoinositides and high membrane curvature

Affiliations

Control of actin polymerization via the coincidence of phosphoinositides and high membrane curvature

Frederic Daste et al. J Cell Biol. .

Abstract

The conditional use of actin during clathrin-mediated endocytosis in mammalian cells suggests that the cell controls whether and how actin is used. Using a combination of biochemical reconstitution and mammalian cell culture, we elucidate a mechanism by which the coincidence of PI(4,5)P2 and PI(3)P in a curved vesicle triggers actin polymerization. At clathrin-coated pits, PI(3)P is produced by the INPP4A hydrolysis of PI(3,4)P2, and this is necessary for actin-driven endocytosis. Both Cdc42⋅guanosine triphosphate and SNX9 activate N-WASP-WIP- and Arp2/3-mediated actin nucleation. Membrane curvature, PI(4,5)P2, and PI(3)P signals are needed for SNX9 assembly via its PX-BAR domain, whereas signaling through Cdc42 is activated by PI(4,5)P2 alone. INPP4A activity is stimulated by high membrane curvature and synergizes with SNX9 BAR domain binding in a process we call curvature cascade amplification. We show that the SNX9-driven actin comets that arise on human disease-associated oculocerebrorenal syndrome of Lowe (OCRL) deficiencies are reduced by inhibiting PI(3)P production, suggesting PI(3)P kinase inhibitors as a therapeutic strategy in Lowe syndrome.


Figures

Figure 1.
Figure 1.
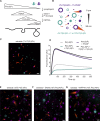
PI(4,5)P2 and PI(3)P signal actin polymerization via SNX9. (A) Cascade of phosphoinositide lipid conversion steps during endocytosis: dephosphorylation of PI(4,5)P2 to PI(4)P by synaptojanin, phosphorylation by PI 3-kinase to produce PI(3,4)P2, and dephosphorylation by INPP4A to form the PI(3)P signal characteristic of the early endosome. (B) Schematic diagram of our cell-free assay for phosphoinositide environment in actin polymerization. Competitive assay that examines phosphoinositide preferences (PI(4,5)P2 + PI(3)P or PI(4,5)P2 + PI(3,4)P2) in the range of curvatures at a budding CCP. (C) Direct observation of liposome samples with a continuous size distribution from 50 nm to 5 µm. Rhodamine fluorescence was used for 4% PI(4,5)P2, 1% PI(3)P, 65% PC, and 30% PS liposomes (all percentages by molecular fraction, purple) and NBD for 4% PI(4,5)P2, 1% PI(3,4)P2, 65% PC, and 30% PS (cyan) using spinning-disk confocal microscopy. (D) Maximal activation of actin polymerization by liposomes containing 4% PI(4,5)P2, 1% PI(3)P, 48% PC, and 47% PS assayed by pyrene actin assay with HSS compared with 4% PI(4,5)P2 alone or 4% PI(4,5)P2 + 1% PI(3,4)P2. Data show mean of four traces from two independent experiments. AU, arbitrary units. (E) As in C, except 10% PI(3,4)P2 (cyan). (F) 10% PI(3,4)P2 liposomes (cyan), extracts + SNX9. In all experiments, we exclusively observed the formation of comet tail at the surface of PI(4,5)P2/PI(3)P liposomes. (G) 10% PI(3,4)P2 liposomes (cyan) preincubated with INPP4A. Actin polymerization occurred from the cyan liposomes. Bars, 3 µm.
Figure 2.
Figure 2.
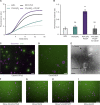
Identifying the minimal machinery required for SNX9-regulated actin assembly. (A) Maximal activation of actin polymerization by liposomes containing 4% PI(4,5)P2 + 1% PI(3)P (with 48% PC and 47% PS) assayed by pyrene actin assay in the minimal reconstituted system (20 nM Arp2/3 complex, 500 nM Cdc42⋅GTP-γS, 100 nM N-WASP/WIP complex, 100 nM SNX9, and 1 µM actin, 65:35 pyrene actin) compared with 4% PI(4,5)P2 alone, actin alone, and activation by GST-VCA fragment from N-WASP as a positive control. Data show the mean of eight traces. AU, arbitrary units. (B) Maximal rates from two technical repeats each of four independent experiments showing the mean and SEM. The maximal rates were normalized against 100% activation by GST-VCA. Significance was tested using an ANOVA test with a Tukey's multiple comparison post-hoc test; actin versus PI(4,5)P2: P = 0.900; actin versus PI(4,5)P2/PI(3)P: ***, P = 0.001; actin versus −Cdc42: P = 0.9000. ns, not significant. (C) Direct observation of liposomes (4% PI(4,5)P2, 1% PI(3)P, 65% PC, 30% PS; purple) in the presence of the minimal purified system containing 50 nM Arp2/3 complex, 50 nM Cdc42⋅GTP-γS, 100 nM N-WASP–WIP complex, 100 nM SNX9, 8 µM unlabeled actin, and 0.3 µM Alexa Fluor 647–labeled actin. Actin asters form at the surface of highly curved liposomes only when all components are present. (D) Activation of Cdc42 is needed. Direct observation of liposome samples with a continuous size distribution from 50 nm to 5 µm (4% PI(4,5)P2, 1% PI(3)P, 65% PC, 30% PS; purple) in the presence of the minimal purified system containing Cdc42⋅GDP. (C and D) Bars, 3 µm. (E) Electron micrograph of actin asters after incubation of PI(4,5)P2/PI(3)P liposomes with the minimal purified system shows disordered and branched actin filaments. Bar, 100 nm. (F–I) All components of the purified system are required for efficient actin polymerization. No actin polymerization is seen with the minimal purified system minus each individual component: Cdc42⋅GTP-γS (F), SNX9 (G), N-WASP–WIP (H), or Arp2/3 complex (I). Bars, 6 µm.
Figure 3.
Figure 3.
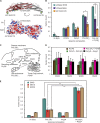
A unique property of SNX9 subfamily in binding two phosphoinositides using two adjacent lipid-binding domains. (A) Mutations in the various proposed lipid-binding sites within the PX and BAR domains of Xenopus SNX9. K511E/K517E, which are residues that make up a positively charged patch within the SNX9 BAR domain, and Y276A/K302A, which is the phosphoinositide lipid–binding pocket within the PX domain. The structure shown is 2RAI, downloaded from the Protein Data Bank and visualized in the CCP4mg molecular graphics package with the Xenopus numbering inferred from a sequence alignment performed in Lasergene software. (B) The liposome compositions used were 5% PI(4,5)P2, 5% PI(3)P, or 4% PI(4,5)P2/1% PI(3)P with 65% PC and 30% PS. Mutagenesis shows that binding of SNX9 to 100-nm PI(4,5)P2 liposomes is driven by positively charged patches on the BAR domain binding to PI(4,5)P2. The pocket on the PX domain is important for binding PI(4,5)P2 and PI(3)P. Data are the mean of three independent liposome batches and sedimentation assays. One-way ANOVA between mutants is not significant for PI(3)P: P = 0.0594. One-way ANOVA between mutants is significant for PI(4,5)P2: P = 0.0133; and PI(4,5)P2/PI(3)P: P = 9.25 × 10⁻⁵. By post-hoc Tukey's honest significant difference (HSD) test, the difference between WT and Y276A/K302A for PI(4,5)P2/PI(3)P: **, P = 0.00223; for PI(4,5)P2: P = 0.864; and for PI(3)P: P = 0.0730. For the WT compared with K511E/K517E mutant with PI(4,5)P2/PI(3)P: **, P = 0.00101; for PI(4,5)P2: *, P = 0.0161; and for PI(3)P: P = 0.098. (C) Phosphoinositides and SNX-BAR proteins in the endosomal network. Schematic diagram showing putative double phosphoinositide compositions for trafficking between compartments where SNX PX–BAR domains are implicated. (D) Sedimentation assay of SNX2, 4, 5, or 8 on liposomes that contain various double phosphoinositide lipid compositions. The liposome compositions were 5% of each phosphoinositide with 65% PC and 30% or 25% PS. Data are the mean of three independent liposome batches and sedimentation assays. No binding is above background suggesting that double phosphoinositide binding is a property specific to the SNX9 subfamily. (E) Sedimentation assay of extracts with liposomes that contain 4% PI(4,5)P2; 1% PI(3)P; or 4% PI(4,5)P2/1% PI(3)P and 65% PC; and 30, 34, or 31% PS with SNX9, 18, and 33 detected by Western blotting. Quantification from three independent liposome batches and Western blots. Error bars are the SEM. One-way ANOVA for SNX9 gives P = 3.113 × 10⁻⁸ with Tukey's post-hoc HSD test between PI(4,5)P2 and PI(4,5)P2/PI(3)P: **, P = 0.00100. One-way ANOVA for SNX18 gives P = 0.0013 with Tukey's post-hoc HSD test between PI(4,5)P2 and PI(4,5)P2/PI(3)P: *, P = 0.0112. One-way ANOVA for SNX33 gives P = 10−6 with Tukey's post-hoc HSD test between PI(4,5)P2 and PI(4,5)P2/PI(3)P: **, P = 0.00101.
Figure 4.
Figure 4.
Membrane curvature-dependent SNX9 binding and INPP4A activity combine to regulate actin polymerization. (A and B) PI(4,5)P2/PI(3)P liposomes (rhodamine-PE labeled) were incubated with Alexa Fluor 647–SNAP-SNX9 from 15 to 250 nM. Concentrations and the fraction of liposomes with SNX9 foci were counted by two-color confocal imaging. Example confocal micrographs of SNX9 (green) bound to 100-nm liposomes (purple, A) and 250-nm liposomes (purple, B). Bars, 3 µm. (C) The number of SNX9 foci per surface area of membrane calculated using the means determined in Fig. S3 C. Data are from three independent experiments. (D) Kinetics of PI(3,4)P2 hydrolysis from 100- or 250-nm vesicles by INPP4A. Initial linear rates over the first 10 min were 0.0028 ± 0.00008 (100-nm vesicles) and 0.0013 ± 0.00021 (250-nm vesicles); P = 0.0037, n = 3 using Student’s t test. Data are from three independent experiments showing the mean and SEM. (E) Cdc42 is not regulated by membrane curvature or PI(3)P. Sedimentation assay of mKate-GBD for Cdc42⋅GTP activation on 100-nm or 250-nm vesicles (various phosphoinositide compositions, control with PC and 30% PS only) shows that Cdc42 activation is curvature independent. Quantification from three independent vesicle batches and Western blots. All error bars show SEM.
Figure 5.
Figure 5.
Membrane curvature preferences in INPP4A and SNX9 propagate to actin polymerization. Direct observation of vesicle samples containing 100-nm (rhodamine fluorescence, purple) and 250-nm (NBD, cyan) vesicles in a 1:1 ratio. (A) The lipid composition was 4% PI(4,5)P2, 1% PI(3)P, 65% PC, and 30% PS, and actin polymerization was triggered by the addition of HSS. (B) The lipid composition was 4% PI(4,5)P2, 1% PI(3)P, 65% PC, and 30% PS, and actin polymerization was triggered by the addition of HSS supplemented with 100 nM SNX9. (C) The lipid composition was 4% PI(4,5)P2, 10% PI(3,4)P2, 65% PC, and 30% PS preincubated with INPP4A. Polymerization was triggered by addition of HSS plus actin. (D) The lipid composition was 4% PI(4,5)P2, 10% PI(3,4)P2, 65% PC, and 30% PS preincubated with INPP4A. Polymerization was triggered by addition of HSS plus 100 nM SNX9 and actin. (E) Quantification of three independent experiments, 10 fields of view per condition (∼700 vesicles). One-way ANOVA between all conditions tested is significant: P = 0.0002. By post-hoc Tukey's HSD test, difference between extracts only and extracts plus SNX9: *, P = 0.040; for extracts only and extracts plus INPP4A: **, P = 0.005; and for extracts only and extracts plus INPP4A + SNX9: **, P = 0.001.
Figure 6.
Figure 6.
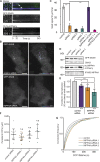
PI(4,5)P2/PI(3)P stimulated actin polymerization functions during CME. (A) TIRFM imaging (4 min) of a cell stably expressing GFP-SNX9 and transiently transfected with clathrin-Lca-mCherry. A region of interest indicated by the white dashed line is presented as a kymograph. SNX9 frequently peaks at the end of the clathrin track, indicated by white arrowheads. Bar, 1 µm. (B) HeLa cells stably expressing GFP-SNX9 are presented from single frames of TIRFM videos. Recordings of the accumulated GFP-SNX9 spots during a 4-min TIFRM time lapse are overlaid in the representative micrographs on the right. Bars, 10 µm. siRNA-mediated INPP4A knockdown decreases the number of SNX9 spots forming at the cell surface. (C) Quantification of SNX9 spot dynamics from three to eight cells per sample from three independent experiments. Student's t test between control and siRNA1: **, P = 0.0043. Between siRNA1 and siRNA1 + muINPP4A1-mCherry: **, P = 0.004. (D) Western blots (WB) showing that levels of GFP-SNX9 and endogenous SNX9 remain the same in INPP4A knockdown cells. Levels of INPP4A are reduced with all three siRNAs against INPP4A. INPP4A was concentrated by immunoprecipitation (IP) and then detected by Western blotting. Expression of murine INPP4A and variant1-mCherry is resistant to INPP4A siRNA1 and 3. (E) Transferrin uptake was reduced on INPP4A reduction and latrunculin A treatment. Transferrin internalization was measured without fetal bovine serum starvation (steady state) to avoid perturbation of CME. Quantification was from three independent experiments; ordinary one-way ANOVA gives P = 0.0033; Tukey's HSD test control to INPP4A siRNA: *, P = 0.0431; control to INPP4A siRNA + Lat: **, P = 0.0021; and control + Lat compared with INPP4A + Lat: *, P = 0.0408. (F) Persistent CCPs (of long duration and large size) are unaffected by INPP4A siRNA. n = 15 control, 13 INPP4A siRNA1-, 8 siRNA2-, and 5 siRNA3-treated cells. ns, not significant. (G) Lifetime of remaining CCPs was increased with INPP4A knockdown. Numbers of CCPs analyzed were control, 4,122; INPP4A siRNA1, 1,340; INPP4A siRNA2, 1,573; and INPP4A siRNA3, 629. Kolmogorov–Smirnov test control versus INPP4A siRNA1 is P < 0.0001, control versus INPP4A siRNA2 is P = 0.0268, and control versus INPP4A siRNA3 is P < 0.0001. Error bars show SEM.
Figure 7.
Figure 7.
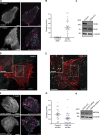
Actin comets in OCRL-deficient RPE cells and their reduction on INPP4A siRNA. (A) Live imaging over a 4-min period of F-tractin expressing control RPE and OCRL KO cells as shown in Video 3, showing motile actin comets in the KO not observed in control cells. The single channel image indicates a single time point, and the colored image shows a projection of the entire time course, temporally colored as indicated. (B) Quantification of actin comets from n = 24 cell regions for each condition. Each data point is plotted individually, along with the mean ± SEM for each condition. Difference assessed by Student’s t test. ***, P < 0.0001. (C) Western blot confirming OCRL KO in the OCRL KO CRISPR/Cas9 edited clone. Levels of SNX9 remain unchanged. α-Tubulin acts as a loading control. (D and E) Control and OCRL KO cells expressing GFP–F-tractin and immunolabeled for SNX9 with enlarged regions as insets. SNX9 puncta are always located at the head of actin comets (arrowheads in E). (F) Live imaging over a 4-min period of F-tractin OCRL KO cells treated with nontargeting control siRNA or INPP4A siRNA1, as shown in Video 5, showing reduction in comets on INPP4A knockdown. Bars: (main images) 10 µm; (insets) 5 µm. (G) Quantification of actin comets from n = 30 cell regions for each treatment. Bars indicate the mean ± SEM for each condition. Difference assessed by Student’s t test. **, P = 0.002. (H) Western blot verifies INPP4A knockdown in the OCRL KO clone.
Figure 8.
Figure 8.
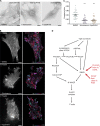
PI 3-kinase inhibitors decrease the number of actin comet tails in OCRL-deficient cells and overall model. (A) Purified mCherry-2×FYVE domain used to stain for PI(3)P in cells fixed after treatment with DMSO control, 2 µM wortmannin, or 10 µM Vps34-IN1 in serum-free media for 1 h before imaging. (B) Representative images from time-lapse videos of OCRL-deficient cells expressing F-tractin and treatment with DMSO or the inhibitors, as shown in Video 6. Actin comets were reduced on PI 3-kinase inhibitor treatment. Bars, 10 µm. (C) Quantification of actin comets from n = 30 cell regions for each treatment. Bars indicate the mean ± SEM for each condition. Difference assessed by ordinary one-way ANOVA with Dunnett’s multiple comparisons test, overall ANOVA, and comparing each inhibitor treatment to DMSO control cells. ***, P ≤ 0.0001. (D) Pathway of curvature signaling to actin polymerization via PI(4,5)P2/PI(3)P/SNX9 during CME. High curvature activates a cascade of phosphoinositol metabolism to change membrane identity and trigger actin polymerization at PI(4,5)P2/PI(3)P-enriched and highly curved sites via the oligomerization of SNX9 during endocytosis. In Lowe syndrome, OCRL deficiency increases PI(4,5)P2 levels on PI(3)P intermediates, triggering SNX9 assembly. PI(4,5)P2 also activates Cdc42 (independently of the curvature) for the relief of N-WASP inhibition. N-WASP oligomerization (via SNX9 binding) finally drives superactivation of the Arp2/3 complex and, thus, actin polymerization.

Similar articles

Cited by

References

    1. Aghamohammadzadeh S., and Ayscough K.R.. 2009. Differential requirements for actin during yeast and mammalian endocytosis. Nat. Cell Biol. 11:1039–1042. 10.1038/ncb1918 - DOI - PMC - PubMed
    1. Aguet F., Antonescu C.N., Mettlen M., Schmid S.L., and Danuser G.. 2013. Advances in analysis of low signal-to-noise images link dynamin and AP2 to the functions of an endocytic checkpoint. Dev. Cell. 26:279–291. 10.1016/j.devcel.2013.06.019 - DOI - PMC - PubMed
    1. Bago R., Malik N., Munson M.J., Prescott A.R., Davies P., Sommer E., Shpiro N., Ward R., Cross D., Ganley I.G., and Alessi D.R.. 2014. Characterization of VPS34-IN1, a selective inhibitor of Vps34, reveals that the phosphatidylinositol 3-phosphate-binding SGK3 protein kinase is a downstream target of class III phosphoinositide 3-kinase. Biochem. J. 463:413–427. 10.1042/BJ20140889 - DOI - PMC - PubMed
    1. Bendris N., Stearns C.J., Reis C.R., Rodriguez-Canales J., Liu H., Witkiewicz A.W., and Schmid S.L.. 2016. Sorting nexin 9 negatively regulates invadopodia formation and function in cancer cells. J. Cell Sci. 129:2804–2816. 10.1242/jcs.188045 - DOI - PMC - PubMed
    1. Billcliff P.G., Noakes C.J., Mehta Z.B., Yan G., Mak L., Woscholski R., and Lowe M.. 2016. OCRL1 engages with the F-BAR protein pacsin 2 to promote biogenesis of membrane-trafficking intermediates. Mol. Biol. Cell. 27:90–107. 10.1091/mbc.E15-06-0329 - DOI - PMC - PubMed

Publication types

MeSH terms

Substances

Associated data