. 2017 Oct 3;114(40):10630-10635.
doi: 10.1073/pnas.1711291114. Epub 2017 Sep 18.

Single-molecule visualization of Saccharomyces cerevisiae leading-strand synthesis reveals dynamic interaction between MTC and the replisome

Affiliations

Single-molecule visualization of Saccharomyces cerevisiae leading-strand synthesis reveals dynamic interaction between MTC and the replisome

Jacob S Lewis et al. Proc Natl Acad Sci U S A. .

Abstract

The replisome, the multiprotein system responsible for genome duplication, is a highly dynamic complex displaying a large number of different enzyme activities. Recently, the Saccharomyces cerevisiae minimal replication reaction has been successfully reconstituted in vitro. This provided an opportunity to uncover the enzymatic activities of many of the components in a eukaryotic system. Their dynamic behavior and interactions in the context of the replisome, however, remain unclear. We use a tethered-bead assay to provide real-time visualization of leading-strand synthesis by the S. cerevisiae replisome at the single-molecule level. The minimal reconstituted leading-strand replisome requires 24 proteins, forming the CMG helicase, the Pol ε DNA polymerase, the RFC clamp loader, the PCNA sliding clamp, and the RPA single-stranded DNA binding protein. We observe rates and product lengths similar to those obtained from ensemble biochemical experiments. At the single-molecule level, we probe the behavior of two components of the replication progression complex and characterize their interaction with active leading-strand replisomes. The Minichromosome maintenance protein 10 (Mcm10), an important player in CMG activation, increases the number of productive replication events in our assay. Furthermore, we show that the fork protection complex Mrc1-Tof1-Csm3 (MTC) enhances the rate of the leading-strand replisome threefold. The introduction of periods of fast replication by MTC leads to an average rate enhancement of a factor of 2, similar to observations in cellular studies. We observe that the MTC complex acts in a dynamic fashion with the moving replisome, leading to alternating phases of slow and fast replication.

Keywords: CMG; DNA replication; Mrc1; replisome; single-molecule biophysics.


Conflict of interest statement

The authors declare no conflict of interest.

Figures

Fig. 1.
Fig. 1.
Single-molecule tethered-bead DNA-stretching assay. (A) Experimental setup. DNA molecules are tethered in a microfluidic flow cell. Beads attached to DNA ends are imaged with wide-field optical microscopy. DNA molecules are stretched by applying a laminar flow of buffer. (B) A representative field of view showing 4,000 beads. (Inset) Image of beads attached to DNA flow-stretched in one direction (magenta) superimposed with an image of the same bead-attached DNA molecules stretched in the opposite direction (green) shows the presence of a large number of DNA-bead tethers. The beads that are improperly tethered are shown in black. (Scale bar, 150 μm.) (C) DNA template. A replication fork was introduced at one end of a 20-kb linear substrate, with a bead attachment site at the other end. The fork is attached to the surface via a biotin on the 5′ tail. (D) Schematic of leading-strand replication by the minimal S. cerevisiae replisome. As dsDNA is converted into ssDNA, the DNA shortens and the bead moves against the direction of flow.
Fig. S1.
Fig. S1.
Length quantification of linear DNA substrate used in tethered-bead assay using single-molecule fluorescence imaging. (A) Histogram showing the length of linear DNA templates. The black line represents a Gaussian fit to the data with a mean length of 20.1 ± 0.2 kb (n = 104 molecules). Error represents SEM. (B) Fluorescence image of a single linear DNA template labeled with SYTOX Orange. Imaging was performed as described in ref. . (Scale bar, 10 μm.)
Fig. S2.
Fig. S2.
Determination of conversion factors of ssDNA coated with either RPA or SSB. (A) First, leading-strand synthesis shortens (Δl1) the DNA by converting the lagging-strand DNA to ssDNA. Next, SSB (or RPA) coats the lagging strand, resulting in lengthening (Δl2) of the DNA. In experiments where SSB is present all of the time, only an effective shortening is seen, that is, (Δl1 − Δl2). To generate ssDNA, strand-displacement synthesis was performed using 60 U/mL of ϕ29 DNA polymerase (New England Biolabs) on surface-tethered forked DNAs containing replication forks in replication buffer as described (20). After strand-displacement synthesis, the flow cell was washed excessively with replication buffer to remove any residual ϕ29 DNA polymerase. Then, either S. cerevisiae RPA or E. coli SSB was flowed in at 250 nM at 15 μL/min. (B) RPA-coated ssDNA has a length similar to that of dsDNA. (C) E. coli SSB-coated ssDNA is shorter than dsDNA. (D) Ratio between S. cerevisiae RPA lengthening and shortening for 25 DNA molecules. Mean ratio 106 ± 10%. (E) Ratio between E. coli SSB lengthening and shortening for 14 DNA molecules. Mean ratio 24 ± 2%. Errors represent the error of the fit.
Fig. S3.
Fig. S3.
SSB and RPA are interchangeable for leading-strand replication. Alkaline agarose gel of leading-strand products by CMGE leading-strand replisomes. Reactions were performed as described in Materials and Methods but included 400 μM dNTPs. Reactions in the presence of either RPA or SSB are shown, both with (lanes 7–12) and without MTC (lanes 1–6). Reactions were stopped at the indicated times.
Fig. 2.
Fig. 2.
Single-molecule visualization of leading-strand synthesis by S. cerevisiae. (A) Representative trajectory showing Pol ε-dependent leading-strand synthesis (left). When Pol ε is omitted no replication events are observed (right). The black lines represent the rate segments identified by the change-point algorithm. (B) Histogram of the instantaneous single-molecule rates. The black line represents a Gaussian fit with a rate of 5.4 ± 0.7 nt/s (mean ± SEM) (n = 161 trajectories). (C) Efficiencies of leading-strand synthesis, defined as the number of beads that show replication events over the total number of correctly tethered beads. The efficiency is approximately threefold higher (11.4 ± 0.2%, n = 3 experiments) in the presence of SSB and Mcm10, compared with experiments without Mcm10 (4.0 ± 0.3%, n = 4 experiments) or without SSB (3.0 ± 0.1%, n = 2 experiments). The errors represent the experimental error.
Fig. S4.
Fig. S4.
Distributions of product lengths for leading-strand replication. (A) Histogram of the total product length per trajectory (0.9 ± 0.2 knt). The fit represents a single-exponential decay function (black line; the first two bins are undersampled and not included in the fit). The error represents the error of the fit. (B) Histogram of the total product length per trajectory for replication by CMGE + Mcm10. A single-exponential fit (black line) shows that the average product length is the same as without Mcm10 (1.4 ± 0.3 knt). (C) Histogram of the total product length per trajectory for replication by CMGE + Mcm10 + MTC, fitted to a single-exponential decay function. The total product length (1.7 ± 0.4 knt) is 1.5-fold higher than the value found in B. (D) Histogram of the total product length per trajectory using CMGE + Mcm10 + TC, fitted to a single-exponential decay function. The total product length (1.0 ± 0.2 knt) is similar to that obtained without TC (n = 111 trajectories). In all product-length histograms, the short values are undersampled and not included in the fits.
Fig. 3.
Fig. 3.
Effect of MTC on replication kinetics. (A) Representative trajectories showing Pol ε-dependent leading-strand synthesis without MTC (left, green), with MTC (middle, blue), and with TC (right, orange). The black lines represent rate segments identified by the change-point algorithm. (B) Average single-molecule rates (mean ± SEM) of all segments determined by the change-point algorithm, using CMGE (8.4 ± 0.5 nt/s), CMGE + Mcm10 (11.0 ± 0.6 nt/s), CMGE + Mcm10 + MTC (19.7 ± 1.2 nt/s), and CMGE + Mcm10 + TC (9.6 ± 0.5 nt/s). (C) Histogram of the instantaneous single-molecule rates for CMGE + Mcm10. The black line represents a Gaussian fit with a mean rate of 11.9 ± 2.2 nt/s, similar to the rates obtained without Mcm10 (Fig. 2B) (n = 96 trajectories). (D) Histogram of the instantaneous single-molecule rates for CMGE + Mcm10 + MTC. The histogram shows a bimodal distribution and was fit with the sum of two Gaussian distributions (black line), resulting in rates of 7.4 ± 0.2 nt/s and 21.1 ± 0.7 nt/s (n = 225 trajectories). (E) Histogram of the instantaneous single-molecule rates for replication by CMGE + Mcm10 + TC (omitting Mrc1). The fast population associated with MTC activity is not present (n = 111 trajectories).
Fig. 4.
Fig. 4.
MTC interaction with the replisome is transient. (A) The number of rate changes per trajectory without MTC (Top) is 4.5 times lower than with MTC present (Bottom). (B) Transition plots showing the rate of a segment as a function of the rate of the previous segment for trajectories with multiple segments, with (Top) and without (Bottom) MTC. The distance from the diagonal (dashed line) is ∼2.5-fold higher with MTC (13.6 ± 1.1 nt/s, mean ± SEM) than without MTC (5.9 ± 0.6 nt/s, mean ± SEM). (C) Histogram of the instantaneous single-molecule rates obtained with MTC present during loading but omitted from the replication phase. The rate is 6.6 ± 0.4 nt/s, similar to the rates obtained in our continuous flow experiments without MTC. No MTC-mediated fast-rate population was observed (n = 101 trajectories). (D) Histogram of the instantaneous single-molecule rates obtained from an experiment where Pol ε was present during loading but omitted from the replication phase. In contrast to the experiment in C, the faster population is present. Fitting with the sum of two Gaussians gives rates of 6.0 ± 0.2 nt/s and 21.1 ± 0.7 nt/s (n = 196 trajectories).
Fig. S5.
Fig. S5.
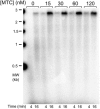
MTC titration into leading-strand replisome reactions. Alkaline agarose gel of leading-strand products at different concentrations of MTC indicated above the gel. Reactions were stopped at the indicated times below the gel. See Materials and Methods for details.
Fig. S6.
Fig. S6.
Six representative trajectories of enzymatic events observed. (A) Three example trajectories showing Pol ε-dependent leading-strand synthesis without MTC. (B) Three example trajectories showing Pol ε-dependent leading-strand synthesis in the presence of 30 nM MTC. The black lines represent the rate segments identified by the change-point algorithm.
Fig. S7.
Fig. S7.
C-terminally tagged MTC (MfTC) transiently interacts with the replisome. (A) Histogram of the instantaneous single-molecule rates, weighted by segment length for replication by CMGE + Mcm10 + 30 nM MfTC. The histogram shows a bimodal distribution of the rates. The data were fit with the sum of two Gaussian distributions (black line), resulting in a rate of 6.0 ± 0.2 nt/s for the slow population and 20.0 ± 0.6 nt/s for the fast population (n = 195 trajectories). (B) Histogram of the total product length per trajectory for replication by CMGE + Mcm10 + 30 nM MfTC. A single-exponential fit (black line) shows that the total product length is similar to the value measured with MTC (1.7 ± 0.4 knt). (C) The number of rate changes per trajectory with MfTC is similar to that with MTC (Fig. 4). (D) Transition plot showing the rate of a segment as a function of the rate of the previous segment for trajectories with multiple segments, with MfTC present. The distance from the diagonal (dashed line) is 12.1 ± 0.9 nt/s (mean ± SEM), similar to MTC (Fig. 4).
Fig. S8.
Fig. S8.
Lower MTC concentrations result in a reduction in the number of fast rates as well as the frequency of transitions within a single trajectory. (A, Top) Histogram of the instantaneous single-molecule rates, weighted by segment length for replication by CMGE + Mcm10 + 10 nM MTC. The histogram shows a bimodal distribution of the rates. The data were fit with the sum of two Gaussian distributions (black line), resulting in a rate of 5.8 ± 0.3 nt/s for the slow population and 17.5 ± 0.6 nt/s for the fast population (n = 251 trajectories). (Bottom) Histogram of the instantaneous single-molecule rates, weighted by segment length for replication by CMGE + Mcm10 + 3 nM MTC. The data were fit with the sum of two Gaussian distributions (black line), resulting in a rate of 6.2 ± 0.3 nt/s for the slow population and 25.3 ± 0.3 nt/s for the fast population (n = 184 trajectories). (B) Transition plots showing the rate of a segment as a function of the rate of the previous segment for trajectories with multiple segments, with 10 nM (Top) and 3 nM (Bottom) MTC present. The perpendicular distance from the diagonal (dashed line) is approximately twofold lower when 3 nM MTC is present (4.5 ± 0.7 nt/s, mean ± SEM) compared with 10 nM MTC (9.5 ± 0.6 nt/s). (C, Top) Histogram of the total product length per trajectory for replication by CMGE + Mcm10 + 10 nM MTC. A single-exponential fit (black line) shows that the product length is the same as the value measured with 30 nM MTC (1.9 ± 0.5 knt). (Bottom) Histogram of the total product length per trajectory for replication by CMGE + Mcm10 + 3 nM MTC. A single-exponential fit (black line) shows that the total product length is similar to the value measured without MTC (1.0 ± 0.2 knt).
Fig. 5.
Fig. 5.
Leading-strand synthesis by the S. cerevisiae replisome. (A) The minimal reconstituted leading-strand replisome supports leading-strand synthesis at a rate of 5.4 ± 0.7 nt/s. (B) Addition of Mcm10 increases the rate ∼1.5 fold (11.9 ± 2.2 nt/s). (C) The MTC complex speeds up the leading-strand replisome by ∼3.5 fold. Our single-molecule measurements demonstrate that MTC has a weak affinity for the replisome and only transiently interacts to speed up replication.
Fig. S9.
Fig. S9.
Purification of MTC, TC, Mcm10, and MfTC. Coomassie blue-stained SDS/PAGE gels of MTC (left), TC (second from left), Mcm10 (third from left), and MfTC (right) are shown. The three left panels are the protein preparations used for this work, with the exception of Fig. S7, which used the MfTC preparation in the rightmost panel. The left two panels (MTC and TC) are an 8% SDS/PAGE, the third (Mcm10) is a 12% SDS/PAGE, and the last (MfTC) is a 4–20% gradient SDS/PAGE. All proteins contain one or two tags, as documented in Materials and Methods.

Similar articles

Cited by

References

    1. Georgescu RE, et al. Reconstitution of a eukaryotic replisome reveals suppression mechanisms that define leading/lagging strand operation. Elife. 2015;4:e04988. - PMC - PubMed
    1. Georgescu RE, et al. Mechanism of asymmetric polymerase assembly at the eukaryotic replication fork. Nat Struct Mol Biol. 2014;21:664–670. - PMC - PubMed
    1. Langston LD, et al. CMG helicase and DNA polymerase ε form a functional 15-subunit holoenzyme for eukaryotic leading-strand DNA replication. Proc Natl Acad Sci USA. 2014;111:15390–15395. - PMC - PubMed
    1. Devbhandari S, Jiang J, Kumar C, Whitehouse I, Remus D. Chromatin constrains the initiation and elongation of DNA replication. Mol Cell. 2017;65:131–141. - PMC - PubMed
    1. Yeeles JTP, Janska A, Early A, Diffley JFX. How the eukaryotic replisome achieves rapid and efficient DNA replication. Mol Cell. 2017;65:105–116. - PMC - PubMed

Publication types

MeSH terms

LinkOut - more resources