

Metformin increases chemo-sensitivity via gene downregulation encoding DNA replication proteins in 5-Fu resistant colorectal cancer cells
- PMID: 28915611
- PMCID: PMC5593582
- DOI: 10.18632/oncotarget.17798
Metformin increases chemo-sensitivity via gene downregulation encoding DNA replication proteins in 5-Fu resistant colorectal cancer cells
Abstract
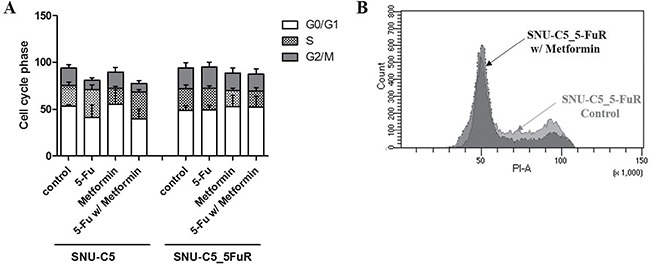
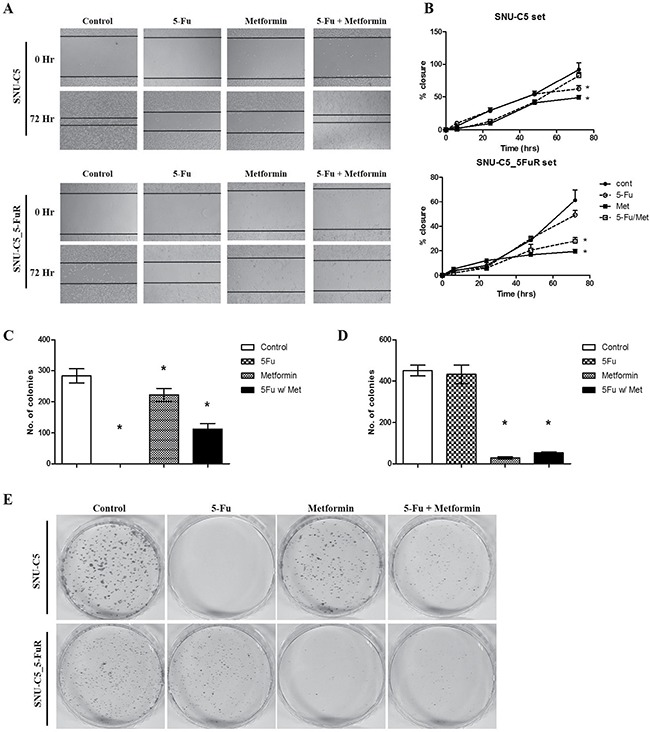
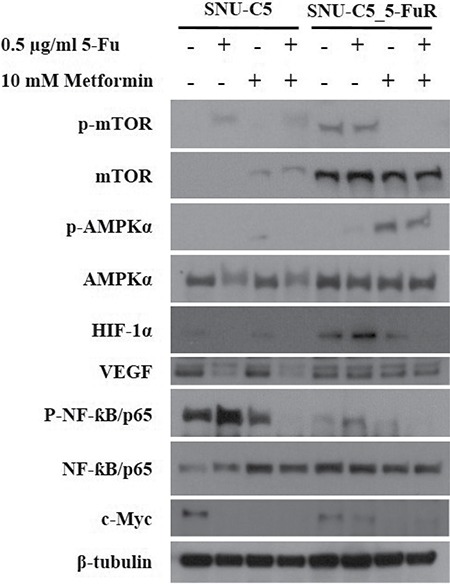
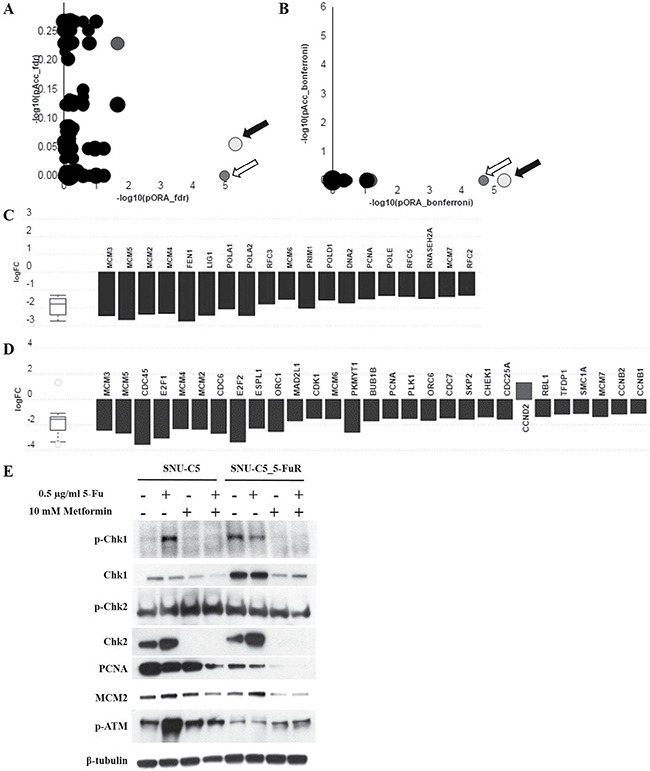
Metformin is most widely prescribed for type 2 diabetes. Recently, evidences have shown that metformin has anticancer effects on pancreatic-, colorectal-, ovarian-, and other cancers. Because metformin has less adverse effects and is inexpensive, it could be a useful chemo-therapeutic agent with anticancer effects. In this study, we demonstrated metformin inhibited by cell proliferation, cell migration ability, clonogenic ability, and cancer stem cell population. Metformin also induced cell cycle arrest in parental-(SNU-C5), and 5-Fu resistant-colorectal cancer cell line (SNU-C5_5FuR). Moreover, a treatment that combines 5-Fu and metformin was found to have a synergistic effect on the cell proliferation rate, especially in SNU-C5_5FuR, which was mediated by the activation of AMPK pathway and NF-ƙB pathway, well-known metformin mechanisms. In this study, we suggested novel anticancer mechanism of metformin that inhibited DNA replication machinery, such as the MCM family in SNU-C5_5FuR. In conclusion, we provided that how metformin acts as not only a chemo-sensitizer, but also as a synergistic effector of 5-Fu in the 5-Fu resistant-cell line. We speculate that metformin used for adjuvant therapy is effective on 5-Fu resistant cancer cells.
Keywords: 5-Fu resistant-cell line; DNA replication; cancer stem cell (CSC); colorectal cancer; metformin.
Conflict of interest statement
CONFLICTS OF INTEREST We confirm that all authors have no conflict of interest. All authors have seen and approved the manuscript.
Figures


Similar articles
-
The anticancer effect of (1S,2S,3E,7E,11E)-3,7,11, 15-cembratetraen-17,2-olide(LS-1) through the activation of TGF-β signaling in SNU-C5/5-FU, fluorouracil-resistant human colon cancer cells.Mar Drugs. 2015 Mar 16;13(3):1340-59. doi: 10.3390/md13031340. Mar Drugs. 2015. PMID: 25786063 Free PMC article.
-
Over-activation of AKT signaling leading to 5-Fluorouracil resistance in SNU-C5/5-FU cells.Oncotarget. 2018 Apr 13;9(28):19911-19928. doi: 10.18632/oncotarget.24952. eCollection 2018 Apr 13. Oncotarget. 2018. PMID: 29731993 Free PMC article.
-
Metformin in combination with 5-fluorouracil suppresses tumor growth by inhibiting the Warburg effect in human oral squamous cell carcinoma.Int J Oncol. 2016 Jul;49(1):276-84. doi: 10.3892/ijo.2016.3523. Epub 2016 May 16. Int J Oncol. 2016. PMID: 27210058
-
Metformin: Insights into its anticancer potential with special reference to AMPK dependent and independent pathways.Life Sci. 2017 Sep 15;185:53-62. doi: 10.1016/j.lfs.2017.07.029. Epub 2017 Jul 26. Life Sci. 2017. PMID: 28755883 Review.
-
Capecitabine: a review.Clin Ther. 2005 Jan;27(1):23-44. doi: 10.1016/j.clinthera.2005.01.005. Clin Ther. 2005. PMID: 15763604 Review.
Cited by
-
Anticancer potential of metformin: focusing on gastrointestinal cancers.Cancer Chemother Pharmacol. 2021 May;87(5):587-598. doi: 10.1007/s00280-021-04256-8. Epub 2021 Mar 20. Cancer Chemother Pharmacol. 2021. PMID: 33744985 Review.
-
Pharmacophore mapping approach to find anti-cancer phytochemicals with metformin-like activities against transforming growth factor (TGF)-beta receptor I kinase: An in silico study.PLoS One. 2023 Nov 9;18(11):e0288208. doi: 10.1371/journal.pone.0288208. eCollection 2023. PLoS One. 2023. PMID: 37943796 Free PMC article.
-
Regulatory Networks of LncRNA MALAT-1 in Cancer.Cancer Manag Res. 2020 Oct 15;12:10181-10198. doi: 10.2147/CMAR.S276022. eCollection 2020. Cancer Manag Res. 2020. PMID: 33116873 Free PMC article. Review.
-
Repurposing metformin for the treatment of gastrointestinal cancer.World J Gastroenterol. 2021 May 7;27(17):1883-1904. doi: 10.3748/wjg.v27.i17.1883. World J Gastroenterol. 2021. PMID: 34007128 Free PMC article. Review.
-
Overcoming Therapy Resistance in Colon Cancer by Drug Repurposing.Cancers (Basel). 2022 Apr 23;14(9):2105. doi: 10.3390/cancers14092105. Cancers (Basel). 2022. PMID: 35565237 Free PMC article. Review.
References
LinkOut - more resources
Full Text Sources
Other Literature Sources
Miscellaneous
