Ionic effects on the temperature-force phase diagram of DNA
- PMID: 28913768
- PMCID: PMC5696306
- DOI: 10.1007/s10867-017-9468-1
Ionic effects on the temperature-force phase diagram of DNA
Abstract
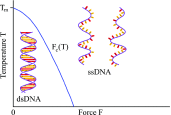
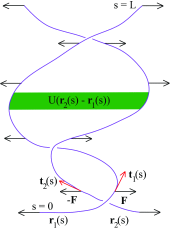
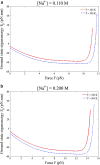
Double-stranded DNA (dsDNA) undergoes a structural transition to single-stranded DNA (ssDNA) in many biologically important processes such as replication and transcription. This strand separation arises in response either to thermal fluctuations or to external forces. The roles of ions are twofold, shortening the range of the interstrand potential and renormalizing the DNA elastic modulus. The dsDNA-to-ssDNA transition is studied on the basis that dsDNA is regarded as a bound state while ssDNA is regarded as an unbound state. The ground state energy of DNA is obtained by mapping the statistical mechanics problem to the imaginary time quantum mechanics problem. In the temperature-force phase diagram the critical force F c (T) increases logarithmically with the Na+ concentration in the range from 32 to 110 mM. Discussing this logarithmic dependence of F c (T) within the framework of polyelectrolyte theory, it inevitably suggests a constraint on the difference between the interstrand separation and the length per unit charge during the dsDNA-to-ssDNA transition.
Keywords: DNA denaturation; DNA unzipping; Debye-Hückel potential; Imaginary time quantum mechanics.
Conflict of interest statement
The author declares that he has no conflicts of interest.
Figures


Similar articles
-
Probing the mechanical stability of DNA in the presence of monovalent cations.J Am Chem Soc. 2008 Apr 16;130(15):5004-5. doi: 10.1021/ja0776576. Epub 2008 Mar 22. J Am Chem Soc. 2008. PMID: 18357985
-
Force induced melting of the constrained DNA.J Chem Phys. 2010 Jun 21;132(23):235105. doi: 10.1063/1.3427587. J Chem Phys. 2010. PMID: 20572742
-
Physical origin of DNA unzipping.J Biol Phys. 2016 Jan;42(1):69-82. doi: 10.1007/s10867-015-9393-0. Epub 2015 Aug 26. J Biol Phys. 2016. PMID: 26306533 Free PMC article.
-
Thermodynamics of DNA interactions from single molecule stretching experiments.Acc Chem Res. 2002 Mar;35(3):159-66. doi: 10.1021/ar010045k. Acc Chem Res. 2002. PMID: 11900519 Review.
-
Elastic Properties of Nucleic Acids by Single-Molecule Force Spectroscopy.Annu Rev Biophys. 2016 Jul 5;45:65-84. doi: 10.1146/annurev-biophys-062215-011158. Epub 2016 Apr 27. Annu Rev Biophys. 2016. PMID: 27145878 Review.
Cited by
-
Structure and Dynamics of dsDNA in Cell-like Environments.Entropy (Basel). 2022 Nov 1;24(11):1587. doi: 10.3390/e24111587. Entropy (Basel). 2022. PMID: 36359677 Free PMC article. Review.
References
-
- Nelson P. Biological Physics: Energy, Information, Life. New York: W. H. Freeman; 2003.
-
- Gelbart WM, Bruinsma RF, Pincus PA, Parsegian VA. DNA-inspired electrostatics. Phys. Today. 2000;53:38–44. doi: 10.1063/1.1325230. - DOI
MeSH terms
Substances
LinkOut - more resources
Full Text Sources
Other Literature Sources

