Data exploration, quality control and statistical analysis of ChIP-exo/nexus experiments
- PMID: 28911122
- PMCID: PMC5587812
- DOI: 10.1093/nar/gkx594
Data exploration, quality control and statistical analysis of ChIP-exo/nexus experiments
Abstract
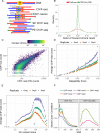
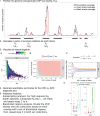
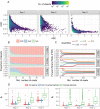
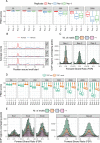
ChIP-exo/nexus experiments rely on innovative modifications of the commonly used ChIP-seq protocol for high resolution mapping of transcription factor binding sites. Although many aspects of the ChIP-exo data analysis are similar to those of ChIP-seq, these high throughput experiments pose a number of unique quality control and analysis challenges. We develop a novel statistical quality control pipeline and accompanying R/Bioconductor package, ChIPexoQual, to enable exploration and analysis of ChIP-exo and related experiments. ChIPexoQual evaluates a number of key issues including strand imbalance, library complexity, and signal enrichment of data. Assessment of these features are facilitated through diagnostic plots and summary statistics computed over regions of the genome with varying levels of coverage. We evaluated our QC pipeline with both large collections of public ChIP-exo/nexus data and multiple, new ChIP-exo datasets from Escherichia coli. ChIPexoQual analysis of these datasets resulted in guidelines for using these QC metrics across a wide range of sequencing depths and provided further insights for modelling ChIP-exo data.
© The Author(s) 2017. Published by Oxford University Press on behalf of Nucleic Acids Research.
Figures
Similar articles
-
ChiLin: a comprehensive ChIP-seq and DNase-seq quality control and analysis pipeline.BMC Bioinformatics. 2016 Oct 3;17(1):404. doi: 10.1186/s12859-016-1274-4. BMC Bioinformatics. 2016. PMID: 27716038 Free PMC article.
-
Large-scale quality analysis of published ChIP-seq data.G3 (Bethesda). 2014 Feb 19;4(2):209-23. doi: 10.1534/g3.113.008680. G3 (Bethesda). 2014. PMID: 24347632 Free PMC article.
-
ChIPulate: A comprehensive ChIP-seq simulation pipeline.PLoS Comput Biol. 2019 Mar 21;15(3):e1006921. doi: 10.1371/journal.pcbi.1006921. eCollection 2019 Mar. PLoS Comput Biol. 2019. PMID: 30897079 Free PMC article.
-
Considerations on Experimental Design and Data Analysis of Chromatin Immunoprecipitation Experiments.Methods Mol Biol. 2018;1689:9-28. doi: 10.1007/978-1-4939-7380-4_2. Methods Mol Biol. 2018. PMID: 29027161 Review.
-
Genome Wide Approaches to Identify Protein-DNA Interactions.Curr Med Chem. 2019;26(42):7641-7654. doi: 10.2174/0929867325666180530115711. Curr Med Chem. 2019. PMID: 29848263 Review.
Cited by
-
MCM2-7 loading-dependent ORC release ensures genome-wide origin licensing.Nat Commun. 2024 Aug 24;15(1):7306. doi: 10.1038/s41467-024-51538-9. Nat Commun. 2024. PMID: 39181881 Free PMC article.
-
IRF5 regulates unique subset of genes in dendritic cells during West Nile virus infection.J Leukoc Biol. 2019 Feb;105(2):411-425. doi: 10.1002/JLB.MA0318-136RRR. Epub 2018 Nov 20. J Leukoc Biol. 2019. PMID: 30457675 Free PMC article.
-
Comparative analysis of ChIP-exo peak-callers: impact of data quality, read duplication and binding subtypes.BMC Bioinformatics. 2020 Feb 21;21(1):65. doi: 10.1186/s12859-020-3403-3. BMC Bioinformatics. 2020. PMID: 32085702 Free PMC article.
References
Publication types
MeSH terms
Substances
Grants and funding
LinkOut - more resources
Full Text Sources
Other Literature Sources
Molecular Biology Databases

