Pyrenoid loss in Chlamydomonas reinhardtii causes limitations in CO2 supply, but not thylakoid operating efficiency
- PMID: 28911055
- PMCID: PMC5853600
- DOI: 10.1093/jxb/erx197
Pyrenoid loss in Chlamydomonas reinhardtii causes limitations in CO2 supply, but not thylakoid operating efficiency
Abstract
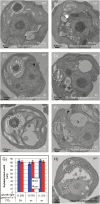
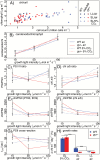
The pyrenoid of the unicellular green alga Chlamydomonas reinhardtii is a microcompartment situated in the centre of the cup-shaped chloroplast, containing up to 90% of cellular Rubisco. Traversed by a network of dense, knotted thylakoid tubules, the pyrenoid has been proposed to influence thylakoid biogenesis and ultrastructure. Mutants that are unable to assemble a pyrenoid matrix, due to expressing a vascular plant version of the Rubisco small subunit, exhibit severe growth and photosynthetic defects and have an ineffective carbon-concentrating mechanism (CCM). The present study set out to determine the cause of photosynthetic limitation in these pyrenoid-less lines. We tested whether electron transport and light use were compromised as a direct structural consequence of pyrenoid loss or as a metabolic effect downstream of lower CCM activity and resulting CO2 limitation. Thylakoid organization was unchanged in the mutants, including the retention of intrapyrenoid-type thylakoid tubules, and photosynthetic limitations associated with the absence of the pyrenoid were rescued by exposing cells to elevated CO2 levels. These results demonstrate that Rubisco aggregation in the pyrenoid functions as an essential element for CO2 delivery as part of the CCM, and does not play other roles in maintenance of photosynthetic membrane energetics.
Keywords: Carbon-concentrating mechanism; Chlamydomonas; Rubisco; chlorophyll fluorescence; chloroplast; electrochromic shift; electron transport rate; green algae; photosynthesis; pyrenoid; reinhardtii.
© The Author 2017. Published by Oxford University Press on behalf of the Society for Experimental Biology.
Figures


Similar articles
-
Pyrenoid loss impairs carbon-concentrating mechanism induction and alters primary metabolism in Chlamydomonas reinhardtii.J Exp Bot. 2017 Jun 1;68(14):3891-3902. doi: 10.1093/jxb/erx121. J Exp Bot. 2017. PMID: 28520898 Free PMC article.
-
Chloroplast-mediated regulation of CO2-concentrating mechanism by Ca2+-binding protein CAS in the green alga Chlamydomonas reinhardtii.Proc Natl Acad Sci U S A. 2016 Nov 1;113(44):12586-12591. doi: 10.1073/pnas.1606519113. Epub 2016 Oct 17. Proc Natl Acad Sci U S A. 2016. PMID: 27791081 Free PMC article.
-
Identification and functional role of the carbonic anhydrase Cah3 in thylakoid membranes of pyrenoid of Chlamydomonas reinhardtii.Biochim Biophys Acta. 2012 Aug;1817(8):1248-55. doi: 10.1016/j.bbabio.2012.02.014. Epub 2012 Feb 21. Biochim Biophys Acta. 2012. PMID: 22709623
-
New horizons for building pyrenoid-based CO2-concentrating mechanisms in plants to improve yields.Plant Physiol. 2022 Oct 27;190(3):1609-1627. doi: 10.1093/plphys/kiac373. Plant Physiol. 2022. PMID: 35961043 Free PMC article. Review.
-
Pyrenoids: CO2-fixing phase separated liquid organelles.Biochim Biophys Acta Mol Cell Res. 2021 Apr;1868(5):118949. doi: 10.1016/j.bbamcr.2021.118949. Epub 2021 Jan 7. Biochim Biophys Acta Mol Cell Res. 2021. PMID: 33421532 Review.
Cited by
-
Effects of microcompartmentation on flux distribution and metabolic pools in Chlamydomonas reinhardtii chloroplasts.Elife. 2018 Oct 11;7:e37960. doi: 10.7554/eLife.37960. Elife. 2018. PMID: 30306890 Free PMC article.
-
Pyrenoid loss impairs carbon-concentrating mechanism induction and alters primary metabolism in Chlamydomonas reinhardtii.J Exp Bot. 2017 Jun 1;68(14):3891-3902. doi: 10.1093/jxb/erx121. J Exp Bot. 2017. PMID: 28520898 Free PMC article.
-
Overcoming adversity through diversity: aquatic carbon concentrating mechanisms.J Exp Bot. 2017 Jun 1;68(14):3689-3695. doi: 10.1093/jxb/erx278. J Exp Bot. 2017. PMID: 28911058 Free PMC article. No abstract available.
-
Transit Peptides Often Require Downstream Unstructured Sequence for Efficient Chloroplast Import in Chlamydomonas reinhardtii.Front Plant Sci. 2022 May 12;13:825797. doi: 10.3389/fpls.2022.825797. eCollection 2022. Front Plant Sci. 2022. PMID: 35646025 Free PMC article.
-
Assembly of the algal CO2-fixing organelle, the pyrenoid, is guided by a Rubisco-binding motif.Sci Adv. 2020 Nov 11;6(46):eabd2408. doi: 10.1126/sciadv.abd2408. Print 2020 Nov. Sci Adv. 2020. PMID: 33177094 Free PMC article.
References
-
- Alric J. 2010. Cyclic electron flow around photosystem I in unicellular green algae. Photosynthesis Research 106, 47–56. - PubMed
-
- Anderson JM, Chow WS, De Las Rivas J. 2008. Dynamic flexibility in the structure and function of photosystem II in higher plant thylakoid membranes: the grana enigma. Photosynthesis Research 98, 575–587. - PubMed
-
- Bailleul B, Cardol P, Breyton C, Finazzi G. 2010. Electrochromism: a useful probe to study algal photosynthesis. Photosynthesis Research 106, 179–189. - PubMed
Publication types
MeSH terms
Substances
Grants and funding
LinkOut - more resources
Full Text Sources
Other Literature Sources

