. 2017 Oct 2;214(10):3123-3144.
doi: 10.1084/jem.20170416. Epub 2017 Sep 13.

The chromatin accessibility signature of human immune aging stems from CD8+ T cells

Affiliations

The chromatin accessibility signature of human immune aging stems from CD8+ T cells

Duygu Ucar et al. J Exp Med. .

Abstract

Aging is linked to deficiencies in immune responses and increased systemic inflammation. To unravel the regulatory programs behind these changes, we applied systems immunology approaches and profiled chromatin accessibility and the transcriptome in PBMCs and purified monocytes, B cells, and T cells. Analysis of samples from 77 young and elderly donors revealed a novel and robust aging signature in PBMCs, with simultaneous systematic chromatin closing at promoters and enhancers associated with T cell signaling and a potentially stochastic chromatin opening mostly found at quiescent and repressed sites. Combined analyses of chromatin accessibility and the transcriptome uncovered immune molecules activated/inactivated with aging and identified the silencing of the IL7R gene and the IL-7 signaling pathway genes as potential biomarkers. This signature is borne by memory CD8+ T cells, which exhibited an aging-related loss in binding of NF-κB and STAT factors. Thus, our study provides a unique and comprehensive approach to identifying candidate biomarkers and provides mechanistic insights into aging-associated immunodeficiency.


Figures

Figure 1.
Figure 1.
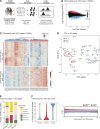
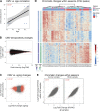
Epigenomic signature of aging in PBMCs. (A) Schema summarizing our study. (B) Plot representing log2 fold change (old-young) versus mean read count for ATAC-seq peaks. Peaks differentially opening (closing) with aging are represented in red (blue). (C) Heat map showing normalized (z scores) chromatin profiles for differentially closing/opening peaks across PBMC samples. (D) Plot of first two principal components (PCs) based on differential peaks confirms that PC1 accounts for the separation between age groups. Percentage of variation among differential peaks accounted for by each PC is shown in parentheses. PC1 from this analysis accounts for ∼7% of the variance in the complete data set. (E) Relative to all peaks tested, differentially closing peaks are enriched in promoters and enhancers, whereas opening peaks are enriched in quiescent and repressed sites. (F) Relationship between peak frequency (i.e., in how many samples/subjects a peak is called) and aging-related change in chromatin accessibility. (left) Differentially closing peaks (in blue) are commonly found across the cohort, whereas opening peaks (in red) tend to be rare or private (all pairwise comparisons between shown distributions are significant after Wilcoxon test, P < 0.01). (right) Log2 fold change (old-young) as a function of peak frequency. Significantly closing and opening peaks are shown in blue and red, respectively. Differential accessibility of ATAC-seq peaks was tested using a GLM based on read counts, with significance assessed at a 5% FDR threshold, after using Benjamini-Hochberg P value adjustment. Tests are based on n = 25 young and n = 19 elderly subjects.
Figure 2.
Figure 2.
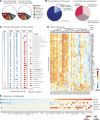
Epigenomic signature of aging at immune-related genes. (A) Major GO category annotations of genes associated with differentially closing and opening peaks. (B) Significant GO terms (P < 0.05 after Bonferroni step-down correction) associated with immune-related genes enriched among genes annotated to differentially closing (n = 6,977; blue, left) and opening (n = 5,649; red, right) peaks. ClueGO was used for enrichment testing and annotation merging, and significance was based on adjusted P values of less than 0.05 after Bonferroni step-down correction. (C) Mean chromatin remodeling (log2 fold change) of genes listed in 28 immune coexpression modules, calculated based on all peaks (leftmost column) and separately using peaks annotated to specific chromHMM states. (D) Subject-specific normalized (z scores) chromatin accessibility patterns of peaks annotated to genes in the T cell coexpression module reveals concerted aging-related variation across the cohort. Warmer (cooler) hues represent increased (decreased) chromatin accessibility relative to the cohort mean. (E) Mean chromatin remodeling (log2 fold change) of peaks annotated to genes in the inflammation I module, calculated based on all peaks (top row) and separately with respect to specific chromHMM state annotations. The test for differential young (n = 25) versus old (n = 19) subject ATAC-seq peaks was based on a GLM, with significance assessed at a 5% Benjamini-Hochberg FDR.
Figure 3.
Figure 3.
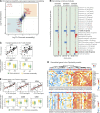
Concordant transcriptional and epigenomic changes associated with aging in PBMCs. (A) Chromatin remodeling at gene promoters correlates significantly with changes in expression of the colocated genes (Pearson r = 0.32, p-value <2.2 × 10⁻¹⁶). Dashed lines delineate the set of peaks (x axis) and genes (y axis) that are differentially accessible or expressed between young and old subjects with a p-value < 0.01 computed from 1,000 random permutations of subject labels. Shaded quadrants define sets of genes showing congruent aging-related shifts in chromatin accessibility and expression. (B) Enrichment level of immune modules among gene sets associated to differentially accessible peaks (left), differentially expressed genes (center), and congruent (concordant) chromatin and expression remodeling (right). Plots show −log10 of hypergeometric test P values, colored according to the direction of difference in accessibility or expression (blue for decrease and red for increase with age). Reference lines are drawn at the largest P value for which a 5% FDR is attained, computed using the Benjamini-Hochberg method. (C) Examples of concordantly remodeled genes from the T cell module. (C, top) Normalized (z scores) for chromatin accessibility and gene expression correlate among subjects. (C, bottom) Both chromatin accessibility at promoters (in yellow) and gene expression (in green) decrease with aging. (D) Promoter chromatin accessibility (top) and gene expression (bottom) of genes in the cytotoxic cells module that show congruent increases in accessibility and expression with aging. Warmer (cooler) hues represent increased (decreased) chromatin accessibility (expression) relative to the cohort mean; data shown as normalized (z scores) values. (E) Examples of concordantly remodeled genes from the cytotoxic cells module. (E, top) Chromatin accessibility and gene expression correlate among subjects. (E, bottom) Both chromatin accessibility (in yellow) and gene expression (in green) increase with aging.
Figure 4.
Figure 4.
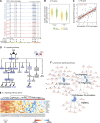
T cell signaling pathways are affected with aging. (A) Genome browser view of IL7R locus highlighting 8 differentially closing peaks (out of 12 annotated to IL7R). Blue and red tracks represent open chromatin profiles of HY (n = 5) and HO (n = 5) samples, respectively. This region also includes the transcription end site (TES) of a nearby gene SPEF2 whose TSS is further away from these differential peaks than IL7R. (B) IL7R expression and chromatin accessibility at its promoter decrease with aging. Box plots represent individuals in the age groups. (C) Promoter chromatin accessibility and gene expression are highly correlated among subjects. (D) Chromatin accessibility of peaks annotated to genes in the IL-7 signaling pathway. Color represents the fold change of the most significantly differential (i.e., lowest P value) peak annotated to this gene. Genes marked in gray are not associated with a significantly closing or opening peak. (E) Subject-specific chromatin accessibility of peaks significantly closing with aging and annotated to genes in the IL-7 signaling pathway. Warmer (cooler) hues represent increased (decreased) chromatin accessibility relative to the cohort mean; data shown as normalized (z scores) values. The test for differential ATAC-seq peaks was based on a GLM, with significance assessed at a 5% Benjamini-Hochberg FDR. (F) ClueGO figure representing the genes that are in T cell signaling pathways that annotate differentially closing peaks (closed circles for genes). Blue portions of pie charts represent the number of genes in the pathway that are associated with a closing peak.
Figure 5.
Figure 5.
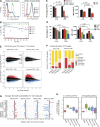
The PBMC aging signature stems mostly from memory CD8+ T cells. (A) Flow cytometry plots in representative young (right) and old (left) subjects illustrate the decrease in IL7R protein levels with aging in CD8+ T cells. (B) Flow cytometry results indicating that the aging-related decrease in IL7R levels is specific to CD8+ T cells. (C) Frequency of pSTAT5+ cells (left) and median fluorescence intensity (MFI) of pSTAT5 in IL-7 stimulated and control gated CD4+ and CD8+ T cell subpopulations in a sample of young (n = 4) and old (n = 4) subjects. A significant aging-related reduction in responsiveness is observed only in CD8+ T cells. (B and C) Error bars represent mean + one standard deviation based on all tested individuals. (D) Frequency of IL7R+ cells (left) and MFI of IL7R (right) on naive, CM, EM, and EMRA CD8+ T cells obtained using flow cytometry on freshly isolated PBMCs (n = 36 young, n = 23 old). P values were calculated using a one-sided Wilcoxon rank-sum test; only significant P values (P < 0.05) are shown. (E) Differential accessibility analyses in T cell subsets show that most significant aging-related remodeling occurs in CD8+ T cells, particularly in memory CD8+ T cells. Plots representing log2 fold change (old-young) versus mean read count for the corresponding ATAC-seq peaks in T cell subsets. Opening (closing) peaks are represented in red (blue). (F) Distribution of differential and all peaks classified by chromHMM state annotations (Roadmap T cell annotations) for memory and naive CD8+ T cells. Promoters and enhancers close with aging in memory CD8+ T cells, similar to PBMCs. Differential accessibility of ATAC-seq peaks was tested using GLMs based on read counts, with significance assessed at a 5% FDR threshold after using Benjamini-Hochberg P value adjustment. All tests based on n = 3 young and n = 4 elderly subjects. (G) Chromatin accessibility remodeling (median fold change) of promoters of selected functionally relevant signaling and surface molecules in naive and memory CD4+ and CD8+ T cells. Red and blue bars represent positive (i.e., opening with aging) and negative (i.e., closing with aging) median fold change, respectively, aggregated over all peaks overlapping promoters of the corresponding gene. (H) Chromatin remodeling of closing PBMC regions associated to genes in the IL-7 signaling pathway (left) and TCR signaling pathway (right) stems from the remodeling in memory CD8+ T cells. Box plots for PBMC and T cell subsets represent distribution of log2 fold changes of peaks annotated to genes that are associated to closing peaks in PBMCs. Boxes and whiskers represent 1× and 1.5× interquartile range of log fold change, respectively.
Figure 6.
Figure 6.
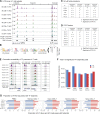
TF activity is repressed specifically in memory CD8+ T cells. (A) Genome browser view of the IL7R locus. Genome browser tracks are generated after pooling three HY and four HO samples using the same individuals for all T cell subsets. (B) TF motifs found at the IL7R promoter (−10,000 bp upstream, +1,000 bp downstream) at a 20% FDR. TFs that are not expressed in PBMCs are filtered out. (C) Summary of TFs that belong to the NF-κB family in terms of expression changes in PBMCs and chromatin changes in PBMCs and CD8+ T cells. These TFs are specifically affected with aging in memory CD8+ T cells. (D) Summary of expression changes in PBMCs and chromatin changes in PBMCs and CD8+ T cells for TFs in the STAT family. Significance of chromatin accessibility and expression values computed using GLMs (5% FDR). These TFs are specifically affected with aging in memory CD8+ T cells. (E) Chromatin accessibility profiles at NF-κB and STAT TF loci in T cell subsets. These TFs lose the chromatin accessibility of their promoters, specifically in memory CD8+ T cells, with aging. Differential peaks (5% FDR) from PBMCs and naive and memory CD8+ T cells are indicated with black bars. (F) Total number of TF footprinting calls obtained in PBMCs and T cell subsets from young (blue) and old (red) samples. All ATAC-seq samples are pooled and randomly downsampled to the same total read count before TF footprinting calls to eliminate potential biases due to depth of sequencing. The number of footprint calls decreases with aging in memory CD8+ T cells. (G) Proportion of ATAC-seq peaks with a footprint for selected TFs. The decrease with aging in the proportion of peaks carrying footprints is specific to memory CD8+ T cells for NF-κB and STAT factors as well as other TFs relevant for T cell functions.
Figure 7.
Figure 7.
Relevance of CMV seropositivity and seasonality as factors influencing aging signature of chromatin accessibility in PBMCs. (A) Correlation between CMV antibody level and age. Note the positive and significant correlation between CMV seropositivity and aging. (B) Plot representing log2 fold change (CMV+ vs. CMV) versus mean read count for ATAC-seq peaks. No differential peaks were obtained at 5% FDR from this comparison. (C) Correlation between peak-specific log fold changes in chromatin accessibility associated with aging and log fold changes associated with CMV seropositivity. Peaks that are closing or opening with aging are shown in red. Note the weak correlation (r = −0.02), suggesting that CMV seropositivity does not explain aging-associated chromatin changes. (D) Heat map showing normalized (z scores) chromatin accessibility profiles of differentially closing and opening peaks across PBMC samples obtained in two seasons. Shades of purple and green on the left represent fold changes in winter and summer samples, respectively. (E) Correlation between peak-specific log fold changes in chromatin accessibility associated with aging for all samples and changes associated with aging for summer (left) and winter (right) samples. Season-specific chromatin changes associated with aging are highly correlated with global changes. Changes in winter are slightly more strongly correlated with the global signature (Pearson r = 0.86 vs. 0.81). Testing of differential chromatin accessibility was based on GLMs, with significance assessed at a 5% FDR threshold computed using Benjamini-Hochberg adjustment. CMV–aging comparisons based on n = 12 young and n = 9 elderly subjects (n = 11 CMV+, n = 10 CMV). Season–aging comparisons based on n = 25 young and n = 19 elderly subjects (n = 17 summer, n = 27 winter samples).

Similar articles

Cited by

References

    1. Aguirre-Gamboa R., Joosten I., Urbano P.C., van der Molen R.G., van Rijssen E., van Cranenbroek B., Oosting M., Smeekens S., Jaeger M., Zorro M., et al. . 2016. Differential effects of environmental and genetic factors on T and B cell immune traits. Cell Reports. 17:2474–2487. 10.1016/j.celrep.2016.10.053 - DOI - PMC - PubMed
    1. Appay V., Zaunders J.J., Papagno L., Sutton J., Jaramillo A., Waters A., Easterbrook P., Grey P., Smith D., McMichael A.J., et al. . 2002. Characterization of CD4+ CTLs ex vivo. J. Immunol. 168:5954–5958. 10.4049/jimmunol.168.11.5954 - DOI - PubMed
    1. Banchereau R., Hong S., Cantarel B., Baldwin N., Baisch J., Edens M., Cepika A.-M., Acs P., Turner J., and Anguiano E.. 2016. Personalized immunomonitoring uncovers molecular networks that stratify lupus patients. Cell. 165:551–565. (published erratum appears in Cell. 2016. http://dx.doi.org/10.1016/j.cell.2016.05.057) 10.1016/j.cell.2016.03.008 - DOI - PMC - PubMed
    1. Benayoun B.A., Pollina E.A., and Brunet A.. 2015. Epigenetic regulation of ageing: Linking environmental inputs to genomic stability. Nat. Rev. Mol. Cell Biol. 16:593–610. 10.1038/nrm4048 - DOI - PMC - PubMed
    1. Berry M.P., Graham C.M., McNab F.W., Xu Z., Bloch S.A., Oni T., Wilkinson K.A., Banchereau R., Skinner J., Wilkinson R.J., et al. . 2010. An interferon-inducible neutrophil-driven blood transcriptional signature in human tuberculosis. Nature. 466:973–977. 10.1038/nature09247 - DOI - PMC - PubMed