ExSTA: External Standard Addition Method for Accurate High-Throughput Quantitation in Targeted Proteomics Experiments
- PMID: 28895300
- PMCID: PMC6084352
- DOI: 10.1002/prca.201600180
ExSTA: External Standard Addition Method for Accurate High-Throughput Quantitation in Targeted Proteomics Experiments
Abstract
Purpose: Targeted proteomics using MRM with stable-isotope-labeled internal-standard (SIS) peptides is the current method of choice for protein quantitation in complex biological matrices. Better quantitation can be achieved with the internal standard-addition method, where successive increments of synthesized natural form (NAT) of the endogenous analyte are added to each sample, a response curve is generated, and the endogenous concentration is determined at the x-intercept. Internal NAT-addition, however, requires multiple analyses of each sample, resulting in increased sample consumption and analysis time.
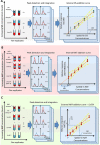
Experimental design: To compare the following three methods, an MRM assay for 34 high-to-moderate abundance human plasma proteins is used: classical internal SIS-addition, internal NAT-addition, and external NAT-addition-generated in buffer using NAT and SIS peptides. Using endogenous-free chicken plasma, the accuracy is also evaluated.
Results: The internal NAT-addition outperforms the other two in precision and accuracy. However, the curves derived by internal vs. external NAT-addition differ by only ≈3.8% in slope, providing comparable accuracies and precision with good CV values.
Conclusions and clinical relevance: While the internal NAT-addition method may be "ideal", this new external NAT-addition can be used to determine the concentration of high-to-moderate abundance endogenous plasma proteins, providing a robust and cost-effective alternative for clinical analyses or other high-throughput applications.
Keywords: ExSTA; Multiple Reaction Monitoring (MRM); external standard addition; quantitative proteomics; standard addition; standard curve.
© 2017 WILEY-VCH Verlag GmbH & Co. KGaA, Weinheim.
Figures


Similar articles
-
Detailed Method for Performing the ExSTA Approach in Quantitative Bottom-Up Plasma Proteomics.Methods Mol Biol. 2021;2228:353-384. doi: 10.1007/978-1-0716-1024-4_25. Methods Mol Biol. 2021. PMID: 33950503
-
Multiplexed MRM-Based Protein Quantitation Using Two Different Stable Isotope-Labeled Peptide Isotopologues for Calibration.J Proteome Res. 2017 Jul 7;16(7):2527-2536. doi: 10.1021/acs.jproteome.7b00094. Epub 2017 Jun 2. J Proteome Res. 2017. PMID: 28516774
-
Protocol for Standardizing High-to-Moderate Abundance Protein Biomarker Assessments Through an MRM-with-Standard-Peptides Quantitative Approach.Adv Exp Med Biol. 2016;919:515-530. doi: 10.1007/978-3-319-41448-5_24. Adv Exp Med Biol. 2016. PMID: 27975233 Review.
-
Absolute Quantitative Targeted Proteomics Assays for Plasma Proteins.Methods Mol Biol. 2023;2628:439-473. doi: 10.1007/978-1-0716-2978-9_27. Methods Mol Biol. 2023. PMID: 36781801
-
Internal standards in the quantitative determination of protein biopharmaceuticals using liquid chromatography coupled to mass spectrometry.J Chromatogr B Analyt Technol Biomed Life Sci. 2012 Apr 15;893-894:1-14. doi: 10.1016/j.jchromb.2012.02.021. Epub 2012 Feb 21. J Chromatogr B Analyt Technol Biomed Life Sci. 2012. PMID: 22426285 Review.
Cited by
-
Targeted MRM Quantification of Urinary Proteins in Chronic Kidney Disease Caused by Glomerulopathies.Molecules. 2023 Apr 9;28(8):3323. doi: 10.3390/molecules28083323. Molecules. 2023. PMID: 37110557 Free PMC article.
-
Proteomic Evolution from Acute to Post-COVID-19 Conditions.J Proteome Res. 2024 Jan 5;23(1):52-70. doi: 10.1021/acs.jproteome.3c00324. Epub 2023 Dec 4. J Proteome Res. 2024. PMID: 38048423 Free PMC article.
-
Affinity-Bead Assisted Mass Spectrometry (Affi-BAMS): A Multiplexed Microarray Platform for Targeted Proteomics.Int J Mol Sci. 2020 Mar 16;21(6):2016. doi: 10.3390/ijms21062016. Int J Mol Sci. 2020. PMID: 32188029 Free PMC article.
-
Proteotyping of knockout mouse strains reveals sex- and strain-specific signatures in blood plasma.NPJ Syst Biol Appl. 2021 May 28;7(1):25. doi: 10.1038/s41540-021-00184-8. NPJ Syst Biol Appl. 2021. PMID: 34050187 Free PMC article.
-
The intestinal microbiome potentially affects thrombin generation in human subjects.J Thromb Haemost. 2020 Mar;18(3):642-650. doi: 10.1111/jth.14699. Epub 2019 Dec 27. J Thromb Haemost. 2020. PMID: 31808596 Free PMC article. Clinical Trial.
References
-
- Palmblad M., Tiss A., Cramer R., Proteomics Clin. Appl. 2009, 3, 6. - PubMed
-
- Apweiler R., Aslanidis C., Deufel T., Gerstner A., Hansen J., Hochstrasser D., Kellner R., Kubicek M., Lottspeich F., Maser E., Mewes H. W., Meyer H. E., Müllner S., Mutter W., Neumaier M., Nollau P., Nothwang H. G., Ponten F., Radbruch A., Reinert K., Rothe G., Stockinger H., Tarnok A., Taussig M. J., Thiel A., Thiery J., Ueffing M., Valet G., Vandekerckhove J., Verhuven W., Wagener C., Wagner O., Schmitz G., Clin. Chem. Lab. Med. 2009, 47, 724. - PubMed
-
- Percy A. J., Chambers A. G., Yang J., Hardie D. B., Borchers C. H., Biochim. Biophys. Acta 2014, 1844, 917. - PubMed
Publication types
MeSH terms
Substances
LinkOut - more resources
Full Text Sources
Other Literature Sources

