

Progressive polarity loss and luminal collapse disrupt tissue organization in carcinoma
- PMID: 28887414
- PMCID: PMC5630022
- DOI: 10.1101/gad.300566.117
Progressive polarity loss and luminal collapse disrupt tissue organization in carcinoma
Abstract
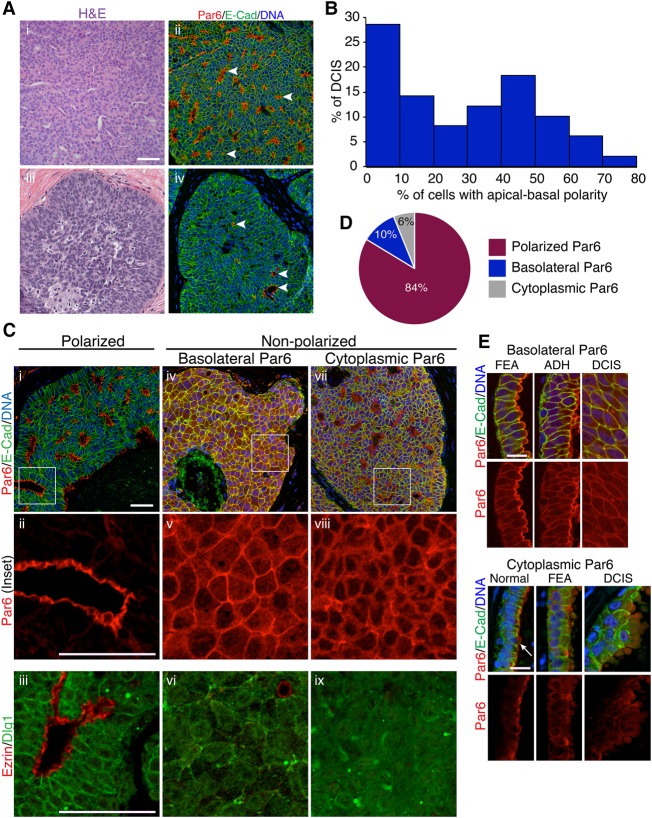
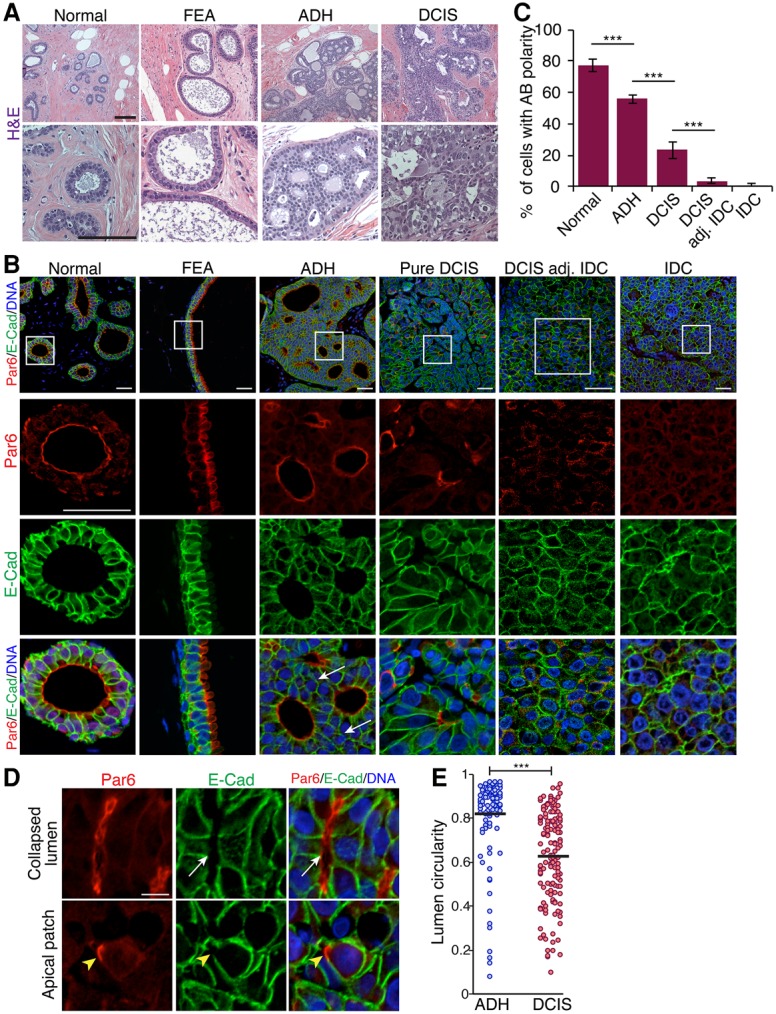
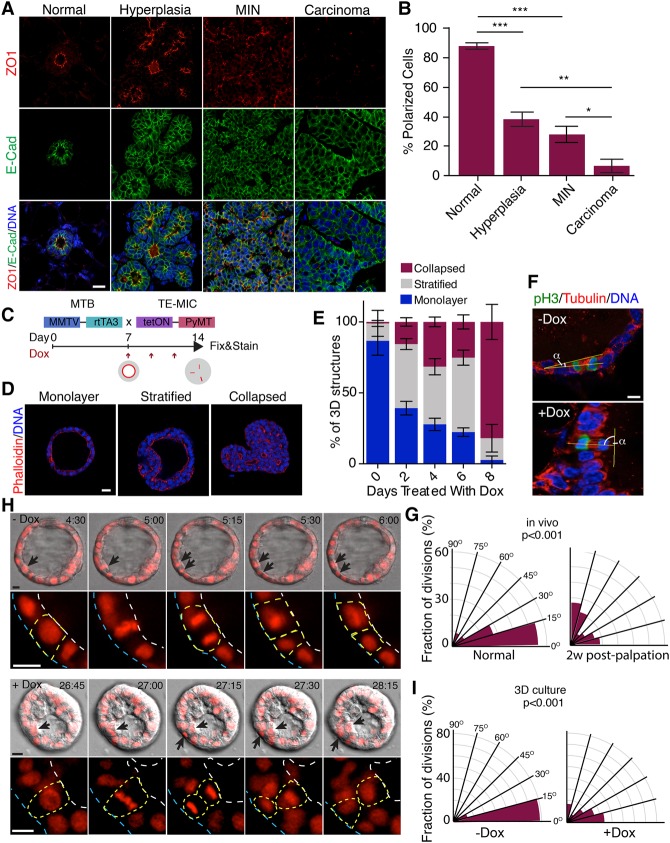
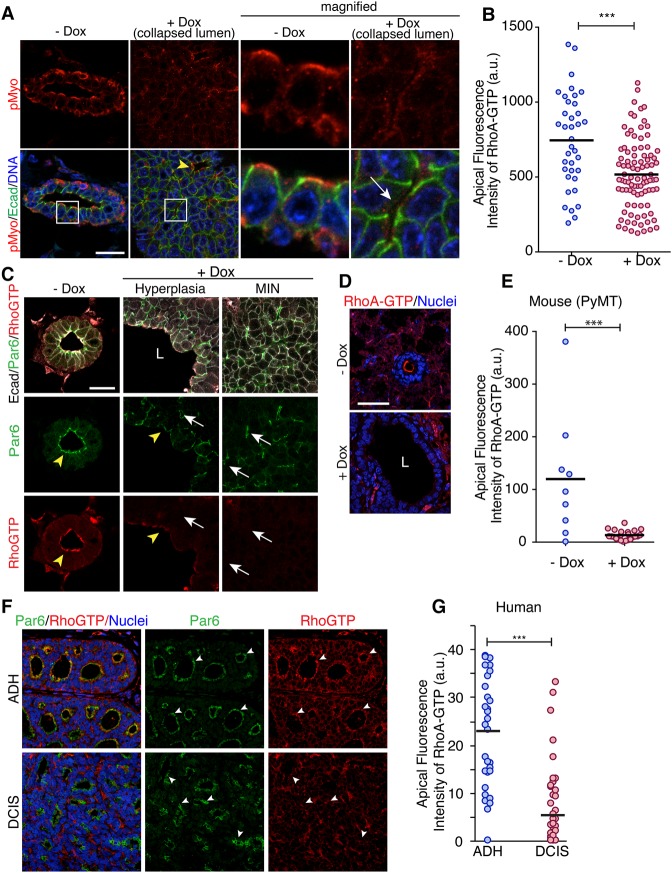
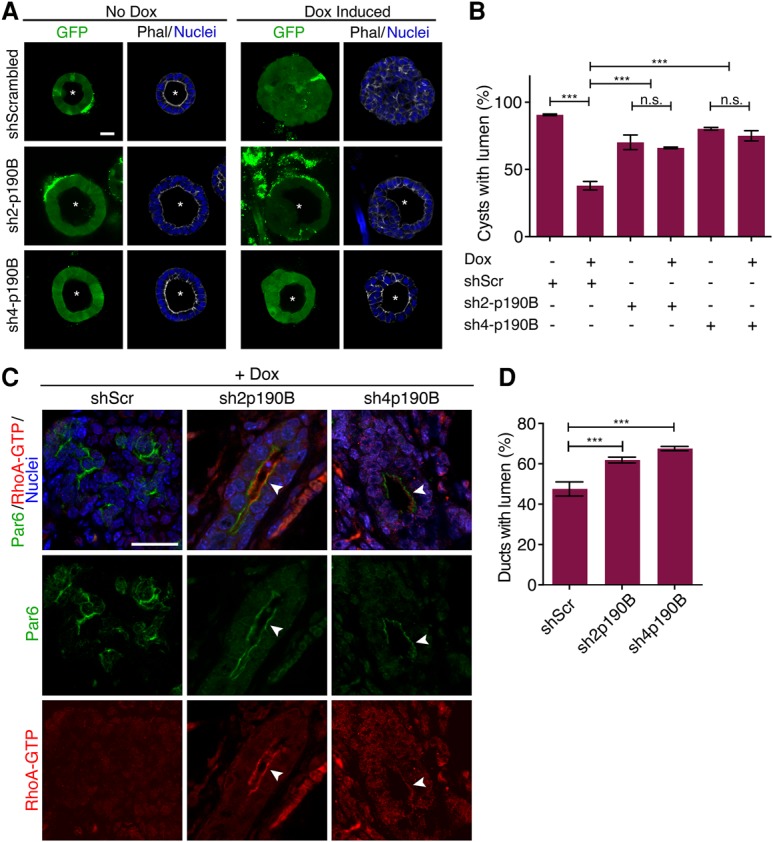
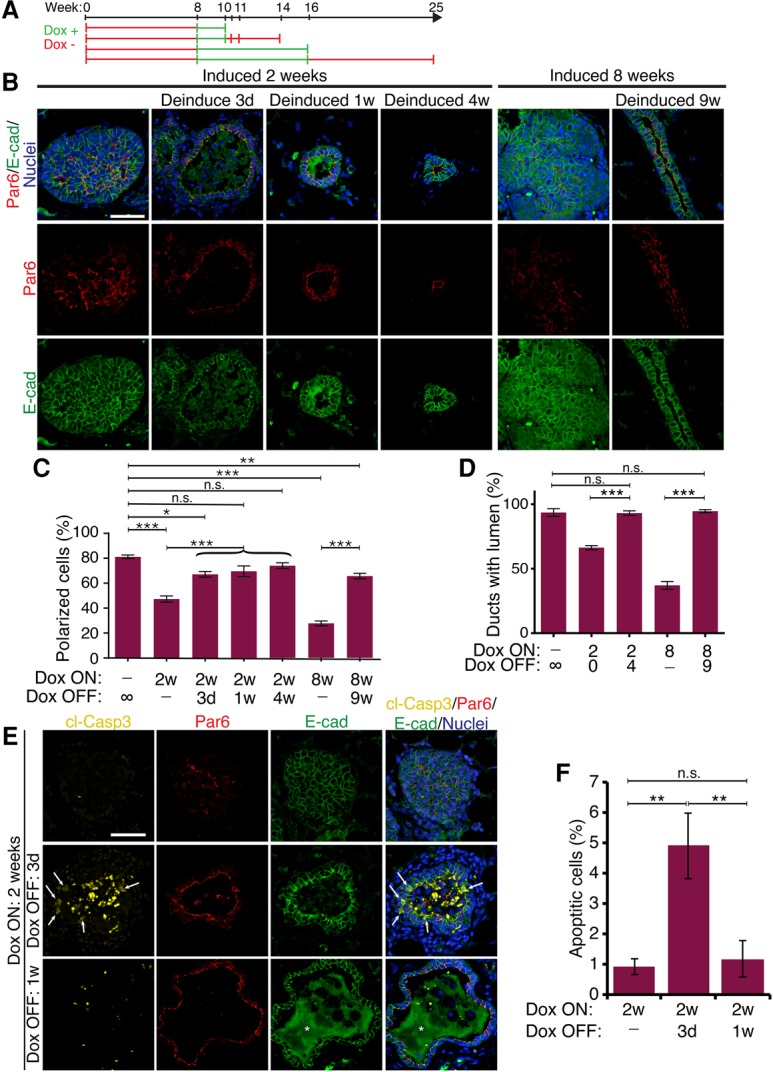
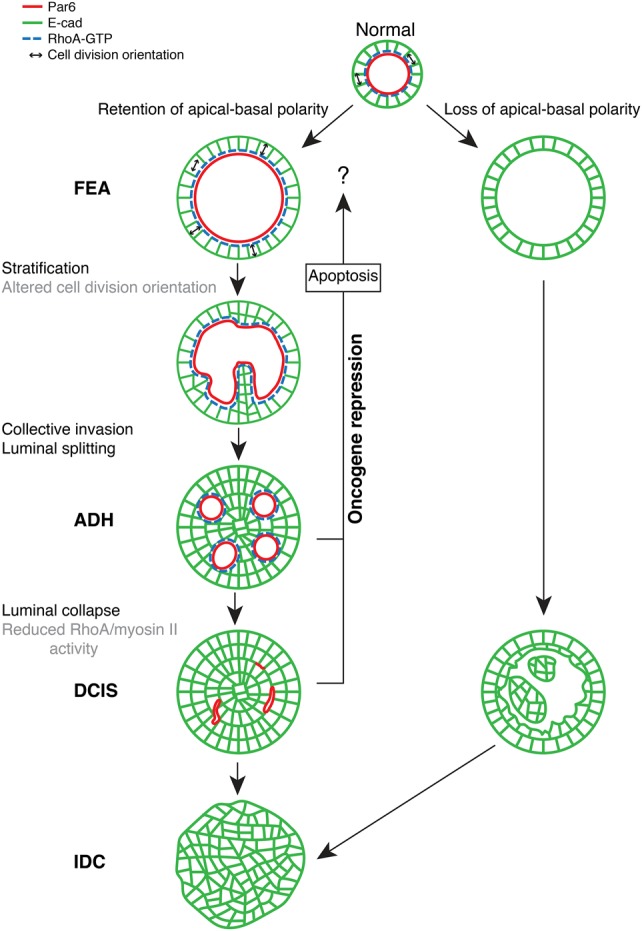
Epithelial cancers (carcinoma) account for 80%-90% of all cancers. The development of carcinoma is associated with disrupted epithelial organization and solid ductal structures. The mechanisms underlying the morphological development of carcinoma are poorly understood, but it is thought that loss of cell polarity is an early event. Here we report the characterization of the development of human breast lesions leading to carcinoma. We identified a unique mechanism that generates solid ducts in carcinoma through progressive loss of polarity and collapse of the luminal architecture. This program initiates with asymmetric divisions of polarized cells that generate a stratified epithelium containing both polarized and depolarized cells. Stratified regions form cords that penetrate into the lumen, subdividing it into polarized secondary lumina. The secondary lumina then collapse with a concomitant decrease in RhoA and myosin II activity at the apical membrane and ultimately lose apical-basal polarity. By restoring RhoA activity in mice, ducts maintained lumen and cell polarity. Notably, disrupted tissue architecture through luminal collapse was reversible, and ducts with a lumen were re-established after oncogene suppression in vivo. This reveals a novel and common mechanism that contributes to carcinoma development by progressively disrupting cell and tissue organization.
Keywords: breast cancer; cancer progression; duct; epithelial; morphogenesis.
© 2017 Halaoui et al.; Published by Cold Spring Harbor Laboratory Press.
Figures
Similar articles
-
ArhGEF18 regulates RhoA-Rock2 signaling to maintain neuro-epithelial apico-basal polarity and proliferation.Development. 2013 Jul;140(13):2787-97. doi: 10.1242/dev.096487. Epub 2013 May 22. Development. 2013. PMID: 23698346
-
Cell Polarity Proteins in Breast Cancer Progression.J Cell Biochem. 2016 Oct;117(10):2215-23. doi: 10.1002/jcb.25553. Epub 2016 Jun 30. J Cell Biochem. 2016. PMID: 27362918 Review.
-
Type I insulin-like growth factor receptor over-expression induces proliferation and anti-apoptotic signaling in a three-dimensional culture model of breast epithelial cells.Breast Cancer Res. 2006;8(2):R18. doi: 10.1186/bcr1392. Epub 2006 Apr 3. Breast Cancer Res. 2006. PMID: 16584539 Free PMC article.
-
Studying Cell Polarity Dynamics During Cancer Initiation Using Inducible 3D Organotypic Cultures.Methods Mol Biol. 2022;2438:455-466. doi: 10.1007/978-1-0716-2035-9_26. Methods Mol Biol. 2022. PMID: 35147957
-
Complex Polarity: Building Multicellular Tissues Through Apical Membrane Traffic.Traffic. 2016 Dec;17(12):1244-1261. doi: 10.1111/tra.12417. Epub 2016 Jul 1. Traffic. 2016. PMID: 27281121 Review.
Cited by
-
Apical-basal polarity and the control of epithelial form and function.Nat Rev Mol Cell Biol. 2022 Aug;23(8):559-577. doi: 10.1038/s41580-022-00465-y. Epub 2022 Apr 19. Nat Rev Mol Cell Biol. 2022. PMID: 35440694 Review.
-
The polarity protein PARD3 and cancer.Oncogene. 2021 Jun;40(25):4245-4262. doi: 10.1038/s41388-021-01813-6. Epub 2021 Jun 7. Oncogene. 2021. PMID: 34099863 Review.
-
Remodelling of the tumour microenvironment by the kallikrein-related peptidases.Nat Rev Cancer. 2022 Apr;22(4):223-238. doi: 10.1038/s41568-021-00436-z. Epub 2022 Jan 31. Nat Rev Cancer. 2022. PMID: 35102281 Review.
-
A proximity proteomics screen in three-dimensional spheroid cultures identifies novel regulators of lumen formation.Sci Rep. 2021 Nov 23;11(1):22807. doi: 10.1038/s41598-021-02178-2. Sci Rep. 2021. PMID: 34815476 Free PMC article.
-
Numb regulates cell tension required for mammary duct elongation.Biol Open. 2019 May 30;8(5):bio042341. doi: 10.1242/bio.042341. Biol Open. 2019. PMID: 31036751 Free PMC article.
References
-
- Allred DC, Wu Y, Mao S, Nagtegaal ID, Lee S, Perou CM, Mohsin SK, O'Connell P, Tsimelzon A, Medina D. 2008. Ductal carcinoma in situ and the emergence of diversity during breast cancer evolution. Clin Cancer Res 14: 370–378. - PubMed
-
- Aranda V, Haire T, Nolan ME, Calarco JP, Rosenberg AZ, Fawcett JP, Pawson T, Muthuswamy SK. 2006. Par6-aPKC uncouples ErbB2 induced disruption of polarized epithelial organization from proliferation control. Nat Cell Biol 8: 1235–1245. - PubMed
-
- Chakravarty G, Roy D, Gonzales M, Gay J, Contreras A, Rosen JM. 2000. P190-B, a Rho-GTPase-activating protein, is differentially expressed in terminal end buds and breast cancer. Cell Growth Differ 11: 343–354. - PubMed
Publication types
MeSH terms
Substances
LinkOut - more resources
Full Text Sources
Other Literature Sources
Medical