. 2017 Oct 13;91(21):e01370-17.
doi: 10.1128/JVI.01370-17. Print 2017 Nov 1.

Expression and Subcellular Localization of the Kaposi's Sarcoma-Associated Herpesvirus K15P Protein during Latency and Lytic Reactivation in Primary Effusion Lymphoma Cells

Affiliations

Expression and Subcellular Localization of the Kaposi's Sarcoma-Associated Herpesvirus K15P Protein during Latency and Lytic Reactivation in Primary Effusion Lymphoma Cells

Caitlin G Smith et al. J Virol. .

Abstract

The K15P membrane protein of Kaposi's sarcoma-associated herpesvirus (KSHV) interacts with multiple cellular signaling pathways and is thought to play key roles in KSHV-associated endothelial cell angiogenesis, regulation of B-cell receptor (BCR) signaling, and the survival, activation, and proliferation of BCR-negative primary effusion lymphoma (PEL) cells. Although full-length K15P is ∼45 kDa, numerous lower-molecular-weight forms of the protein exist as a result of differential splicing and poorly characterized posttranslational processing. K15P has been reported to localize to numerous subcellular organelles in heterologous expression studies, but there are limited data concerning the sorting of K15P in KSHV-infected cells. The relationships between the various molecular weight forms of K15P, their subcellular distribution, and how these may differ in latent and lytic KSHV infections are poorly understood. Here we report that a cDNA encoding a full-length, ∼45-kDa K15P reporter protein is expressed as an ∼23- to 24-kDa species that colocalizes with the trans-Golgi network (TGN) marker TGN46 in KSHV-infected PEL cells. Following lytic reactivation by sodium butyrate, the levels of the ∼23- to 24-kDa protein diminish, and the full-length, ∼45-kDa K15P protein accumulates. This is accompanied by apparent fragmentation of the TGN and redistribution of K15P to a dispersed peripheral location. Similar results were seen when lytic reactivation was stimulated by the KSHV protein replication and transcription activator (RTA) and during spontaneous reactivation. We speculate that expression of different molecular weight forms of K15P in distinct cellular locations reflects the alternative demands placed upon the protein in the latent and lytic phases.IMPORTANCE The K15P protein of Kaposi's sarcoma-associated herpesvirus (KSHV) is thought to play key roles in disease, including KSHV-associated angiogenesis and the survival and growth of primary effusion lymphoma (PEL) cells. The protein exists in multiple molecular weight forms, and its intracellular trafficking is poorly understood. Here we demonstrate that the molecular weight form of a reporter K15P molecule and its intracellular distribution change when KSHV switches from its latent (quiescent) phase to the lytic, infectious state. We speculate that expression of different molecular weight forms of K15P in distinct cellular locations reflects the alternative demands placed upon the protein in the viral latent and lytic stages.

Keywords: K15P; Kaposi's sarcoma-associated herpesvirus; latent and lytic infection; subcellular localization.


Figures

FIG 1
FIG 1
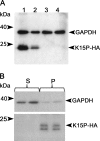
Expression of the K15P 8-exon cDNA in PEL cells. (A) RIPA extracts of cells were subjected to denaturing SDS-PAGE and Western blotted with anti-HA and anti-GAPDH antibodies (loading control), as indicated at right. Lanes: 1, BCBL-1-HA; 2, BJAB-HA; 3, BCBL-1; 4, BJAB. Positions of molecular size markers are indicated at left. (B) A PNS was prepared from BCBL-1-HA cells, and duplicate samples were subjected to centrifugation at 50,000 × g to prepare pellet (P) or supernatant (S) fractions. After SDS-PAGE and Western blotting, the membrane was probed exactly as described for panel A.
FIG 2
FIG 2
K15P-HA does not colocalize with lysosomal or mitochondrial markers in a density fractionation gradient. The PNS from BCBL-1-HA cells was loaded at the top of a 2.5% to 30% iodixanol gradient and subjected to ultracentrifugation and then SDS-PAGE and Western blotting of fractions from top (fraction 1) to bottom (fraction 24). Blots were probed with antibodies against K15P-HA (HA), the endoplasmic reticulum (PDI), the Golgi apparatus (p58K), the plasma membrane (Na/K [Na+/K+ ATPase]), mitochondria (SMAC), and lysosomes (CB [cathepsin B]), as indicated at right. Positions of molecular size markers are indicated at left.
FIG 3
FIG 3
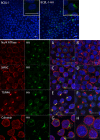
Localization of K15P-HA in BCBL-1-HA cells. The top row shows BCBL-1 (left) and BCBL-1-HA (right) cells stained with DAPI (blue) and anti-HA antibody (green). Insets show higher-magnification images of cells from similar fields. The lower panels show merged images of fields of BCBL-1-HA (A, C, E, and G) and control BCBL-1 (B, D, F, and H) cells stained with DAPI (blue) and immunostained for K15P-HA (green) and an organellar marker (red). Organellar antigens label the plasma membrane (Na+/K+ ATPase) (A and B), mitochondria (SMAC) (C and D), the trans-Golgi network (TGN46) (E and F), and the endoplasmic reticulum (calnexin) (G and H). For each BCBL-1-HA merged image (A, C, E, and G), the individual green and red channels are shown to the left. Bars, 20 μm.
FIG 4
FIG 4
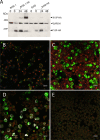
Effects of sodium butyrate treatment on K15P-HA expression and localization. (A) Western blot for K15P-HA following sodium butyrate treatment. BCBL-1-HA, BJAB-HA, and parental BCBL-1 and BJAB cells were incubated with 1 mM sodium butyrate for 0, 24, or 48 h (as indicated above the lanes). Extracts were subjected to SDS-PAGE, Western blotted, and probed with anti-HA or anti-GAPDH antibody, as indicated at right. (B to D) Merged images of fields of BCBL-1-HA cells fixed and immunostained after incubation with sodium butyrate for 0 h (B), 30 h (C), or 48 h (D). (E) Control BJAB cells similarly incubated with sodium butyrate for 48 h. All fields were immunostained for TGN46 (red channel) and HA (green channel). Fields in panels D and E were also stained for the KSHV lytically expressed protein K8α (white channel). The anti-HA immunostaining in panel B is weaker than that shown for BCBL-1-HA cells in Fig. 3 because imaging conditions were chosen to avoid saturation of the green channel resulting from elevated expression of K15P-HA in panels C and D. Bars, 20 μm.
FIG 5
FIG 5
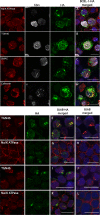
Effects of sodium butyrate treatment on K15P-HA localization in BCBL-1 and BJAB cells. (A to D) BCBL-1-HA cells were incubated with sodium butyrate for 48 h and then fixed and immunostained using antibodies against the KSHV lytically expressed protein K8α (white channel), HA (green channel), and the organellar markers Na+/K+ ATPase (A), TGN46 (B), SMAC (C), and calnexin (D) (red channel). For each BCBL-1-HA merged image, the individual red, white, and green channels are shown to the left. (E to H) BJAB-HA or control BJAB cells were immunostained for HA (green channel) and the plasma membrane marker Na+/K+ ATPase or the TGN marker TGN46 (red channel), as indicated. For each BJAB-HA merged image, the individual red and green channels are shown to the left. (I to L) Identical to panels E to H except that cells were incubated with sodium butyrate for 48 h before fixation and immunostaining. Bars, 20 μm.
FIG 6
FIG 6
Effects of RTA expression on K15P-HA. (A) BCBL-1-HA or parental BCBL-1 cells were electroporated with 10 μg of the RTA expression plasmid pSG5-Rta. Zero, 24, 48, or 72 h after electroporation (as indicated above the lanes), cells were harvested, subjected to SDS-PAGE, and Western blotted with anti-HA or anti-GAPDH antibody, as indicated at right. Positions of molecular size markers are shown at left. (Top) Expression of the ∼45-kDa and ∼23-kDa forms of K15P-HA. (Middle) Region from top panel with contrast adjusted to show the ∼45-kDa K15P-HA band. (Bottom) GAPDH loading control. (B) BCBL-1-HA or parental BCBL-1 cells were electroporated with no DNA, 7 μg or 10 μg of pSG5-Rta, or a control plasmid, as indicated above the lanes. After 48 h, cells were collected and processed exactly as described for panel A. (C) BCBL-1-HA cells were electroporated with pSG5-Rta and after 48 h were attached to coverslips, fixed, stained with DAPI (blue channel), and immunostained for HA (green channel), K8α (white channel), and TGN46 (red channel). An individual K8α-positive cell is shown surrounded by K8α-negative cells. (D) Identical to panel C except that anti-TGN staining was omitted. For panels C and D, conditions were chosen to image the elevated levels of anti-HA staining in K8α-positive cells. Bars, 20 μm.
FIG 7
FIG 7
K15P-HA in spontaneously reactivating cells. Fields of BCBL-1-HA cells were fixed, stained with DAPI (blue channel), and immunostained for HA (green channel), K8α (white channel), and TGN46 (red channel). (A to F) Merged images of fields containing K8α-negative cells and a spontaneously arising K8α-positive cell. To the right of each merged image is an identical panel in which the green channel has been omitted to better reveal TGN46 staining. For all panels, conditions were chosen to image the elevated levels of anti-HA staining in K8α-positive cells. Bars, 20 μm.
FIG 8
FIG 8
Quantitation of K15P-HA and TGN46 staining patterns. (A) Fields of BCBL-1-HA cells were immunostained for HA and K8α. The numbers of cells displaying compact (white bars), intermediate (gray bars), and dispersed (black bars) patterns of HA immunoreactivity (see the text for more details) were counted and plotted as percentages of the total. Cell conditions are indicated below each set of bars, as follows: latent, untreated cells that were K8α negative (250 cells counted from 4 fields); K8α+ (butyrate), cells that were K8α positive following incubation with 1 mM sodium butyrate for 48 h (97 cells counted from 6 fields); and K8α+ (spontaneous), untreated cells that were K8α positive (17 cells counted from 13 fields). (B) Identical to panel A except that cells were stained and their morphology scored for TGN46. Cell numbers were as follows: latent, 214 cells counted from 17 fields; K8α+ (butyrate), 91 cells counted from 9 fields; and K8α+ (spontaneous), 22 cells counted from 18 fields. The small numbers of spontaneously occurring K8α-positive cells that were counted reflect the rare nature of the phenotype.

Similar articles

Cited by

References

    1. Chang Y, Moore P. 2014. Twenty years of KSHV. Viruses 6:4258–4264. doi:10.3390/v6114258. - DOI - PMC - PubMed
    1. Giffin L, Damania B. 2014. KSHV: pathways to tumorigenesis and persistent infection. Adv Virus Res 88:111–159. doi:10.1016/B978-0-12-800098-4.00002-7. - DOI - PMC - PubMed
    1. Wong EL, Damania B. 2005. Linking KSHV to human cancer. Curr Oncol Rep 7:349–356. doi:10.1007/s11912-005-0061-6. - DOI - PubMed
    1. Fukumoto H, Kanno T, Hasegawa H, Katano H. 2011. Pathology of Kaposi's sarcoma-associated herpesvirus infection. Front Microbiol 2:175. doi:10.3389/fmicb.2011.00175. - DOI - PMC - PubMed
    1. Soulier J, Grollet L, Oksenhendler E, Cacoub P, Cazals-Hatem D, Babinet P, d'Agay MF, Clauvel JP, Raphael M, Degos L, Sigaux F. 1995. Kaposi's sarcoma-associated herpesvirus-like DNA sequences in multicentric Castleman's disease. Blood 86:1276–1280. - PubMed

Publication types

MeSH terms

Substances

LinkOut - more resources