. 2017 Aug 21;13(8):e1006544.
doi: 10.1371/journal.ppat.1006544. eCollection 2017 Aug.

Transient expression of ZBTB32 in anti-viral CD8+ T cells limits the magnitude of the effector response and the generation of memory

Affiliations

Transient expression of ZBTB32 in anti-viral CD8+ T cells limits the magnitude of the effector response and the generation of memory

Hyun Mu Shin et al. PLoS Pathog. .

Abstract

Virus infections induce CD8+ T cell responses comprised of a large population of terminal effector cells and a smaller subset of long-lived memory cells. The transcription factors regulating the relative expansion versus the long-term survival potential of anti-viral CD8+ T cells are not completely understood. We identified ZBTB32 as a transcription factor that is transiently expressed in effector CD8+ T cells. After acute virus infection, CD8+ T cells deficient in ZBTB32 showed enhanced virus-specific CD8+ T cell responses, and generated increased numbers of virus-specific memory cells; in contrast, persistent expression of ZBTB32 suppressed memory cell formation. The dysregulation of CD8+ T cell responses in the absence of ZBTB32 was catastrophic, as Zbtb32-/- mice succumbed to a systemic viral infection and showed evidence of severe lung pathology. We found that ZBTB32 and Blimp-1 were co-expressed following CD8+ T cell activation, bound to each other, and cooperatively regulated Blimp-1 target genes Eomes and Cd27. These findings demonstrate that ZBTB32 is a key transcription factor in CD8+ effector T cells that is required for the balanced regulation of effector versus memory responses to infection.


Conflict of interest statement

The authors have declared that no competing interests exist.

Figures

Fig 1
Fig 1. Inflammatory cytokines induce maximal transcription of Zbtb32.
(a) Purified CD8+ T cells from WT or Zbtb32-/- mice were activated with αCD3/CD28 in vitro as indicated, then harvested for immunoblotting with rabbit αZBTB32 antibody. Data are representative of two independent experiments.(b) CD8+ T cells were pre-activated with or without αCD3/CD28 for 24h (1o) and then stimulated with indicated cytokines for 1 day (2o) and Zbtb32 mRNA was analyzed by Q-PCR relative to Actb mRNA. (c) Pre-activated (1o) WT CD8+ T cells were stimulated with or without (2o) IL-2 (left), IFN-β (middle) or IL-12 (right) for 30 min for ChIP assay. Binding of STAT-5 (left), STAT-1 (middle) or STAT-4 (right) at AmpA (target regions) of Zbtb32 is depicted. (d) ChIP-seq analysis of STAT5A and STAT5B binding [26] and histone H3-acetylation (H3Ac) at Zbtb32. H3Ac ChIP-seq was performed on naïve OT-I CD8+ T cells stimulated with αCD3/CD28 in vitro for three days with IL-2 (IL-2 STIM) or αCD25/αCD122/αIL-2 (IL-2 BLOCK). Binding enrichment for STAT5A/B correlates with significant changes in H3Ac in IL-2 STIM versus IL-2 BLOCK. The positions of AmpA and B (target regions) and AmpC (non-specific control) used in panels B and D are shown on the Zbtb32 locus. (e) Pre-activated (1o) WT CD8+ T cells were stimulated in vitro with or without IL-2, IFNβ and IL-12 (2o) for 3 hours. Chromatin was prepared for Pol II, H3Ac, H3K3me3 and H3K27me3 ChIP analysis compared to isotype control (Iso). ChIP eluates were amplified by Q-PCR for the indicated regions of the Zbtb32 gene locus (AmpA).Data (b,c and e) are compilations from three independent experiments; error bars represent SEM.
Fig 2
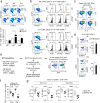
Fig 2. Enhanced CD8+ T cell response to acute virus infection in the absence of ZBTB32.
(a) WT P14 CD8+ cells (5x10⁴) were transferred to recipients, which were then infected with LCMV-Armstrong. P14 cells were isolated and pooled from three mice at days 3, 6, 8, 10, 14 and 30 post-infection. Zbtb32 mRNA was analyzed by quantitative RT-PCR relative to Actb mRNA. Day 0 represents P14 cells from naïve mice. The graph shows a compilation of data from three independent experiments; error bars represent the SEM. (b) The percentages ± SEM (left panels) and total numbers ± SEM (right graphs) of LCMV-specific CD8+ T cells in splenocytes from WT and Zbtb32-/- mice were enumerated at days 6, 8 and 45 post-LCMV-Armstrong infection. Virus-specific CD8+ T cells were identified by Class-I MHC tetramer staining. Data are representative of two independent experiments for day 6 and three independent experiments for days 8 and 45, with 3 mice per genotype per experiment. (c,d) Splenocytes were isolated at days 8 and 45 from LCMV-infected WT and Zbtb32-/- mice and were stimulated with NP396 (left) or GP33 (right) peptide followed by intracellular cytokine staining. Percentages ± SEM of (c) IFNγ + or (d) TNFα+ IL-2+ of IFNγ-producing virus-specific CD8+ T cells are depicted. Data are representative of three independent experiments with three mice per genotype per experiment. (e) Splenocytes from day 7 and 14 VACV-infected WT and Zbtb32-/- mice were stimulated with VACV-specific B8R peptides followed by intracellular cytokine staining. Percentages ± SEM (left panels) or absolute numbers ± SEM (right graphs) of VACV-specific CD8+ T cells are depicted. Data are representative of two independent experiments with three mice per genotype per experiment.
Fig 3
Fig 3. ZBTB32 is required intrinsically in CD8+ T cells to regulate memory cell development during acute virus infection.
(a-b) WT or Zbtb32-/- P14 splenocytes (CD90.1+) were adoptively transferred into CD90.2+ recipient mice followed by LCMV-Armstrong infection. (a) The percentages (top panels) and total numbers (graph below) of splenic P14 cells were enumerated at days 6, 9 and 15 post-infection. (b) At days 9 and 15, P14 cells were analyzed for memory markers as indicated. (c) P14 cells were cultured with GP33 peptide followed by intracellular cytokine staining. Plots show percentages ± SEM of TNF+ IL-2+ cells gated on P14 IFNγ+ cells. (d) Plots show percentages ± SEM of Eomes-positive splenic P14 cells and the MFI ± SEM of EOMES expression at day 9 (top) and day 15 (bottom) post infection. Data are representative of two independent experiments with three mice per genotype per experiment for day 6, and three independent experiments with three mice per genotype per experiment for days 9 and 15 post-infection. (e-g) Congenically-marked WT P14 cells stimulated in vitro with αCD3/CD28 for 24 hours were transduced with ZBTB32-expressing retrovirus (Zbtb32 RV) or mock retrovirus (mock RV) and then the two populations (mixed 1:1) were co-transferred into recipients, which were infected with LCMV-Armstrong. (e) A subset of transduced P14 cells was cultured in vitro for additional 2 days, and the transduction efficiency assessed by GFP fluorescence. At days 14 and 45 post-transfer and LCMV infection, P14 cells were analyzed for their (f) frequencies and for the (g) percentages ± SEM and MFI of IL-7R expression on each population. All data are compiled from two independent experiments with nine recipient mice for day 14 and six recipient mice for day 45.
Fig 4
Fig 4. Zbtb32-/- memory CD8+ T cells are functionally superior to WT memory cells.
(a-d) WT or Zbtb32-/- P14 splenocytes (CD90.1+) were adoptively transferred into CD90.2+ recipient mice followed by LCMV-Armstrong infection. (a) The percentages (left panels) and total numbers (graph at right) of splenic P14 cells were enumerated at day 30 post-infection. (b) At day 30, P14 cells were analyzed for memory markers as indicated. (c,d) P14 cells were cultured with GP33 peptide followed by intracellular cytokine staining. Plots show percentages ± SEM of TNF+ IL-2+ cells gated on P14 IFNγ+ cells. Data are representative of two independent experiments with three mice per genotype per experiment for day 30 post-infection. (e,f) At day 30 post-transfer and LCMV infection, WT or Zbtb32-/- P14 cells were isolated, and 1x10⁵ of each population were transferred into naïve recipients, which were challenged with LCMV-Armstrong. At day 5 post-challenge, the percentages ± SEM (top) and numbers ± SEM (bottom) of P14 cells were analyzed in the spleen (f). Data are representative of two independent experiments with five mice per genotype of donor cells per experiment.
Fig 5
Fig 5. Increased immunopathology and reduced survival of Zbtb32-/- mice in response to chronic LCMV infection.
WT or Zbtb32-/- mice were infected intravenously with high dose LCMV-clone 13. (a) The percent survival (top) and percentage of original body weight (bottom) of mice were recorded as indicated. The graphs include compilations of three independent experiments; error bars represent the SEM (bottom). (b,c) At days 0 and 10 post-infection, lung sections were stained with hematoxylin and eosin and displayed at 4x (top) or 20x (below) (b) and histology of lung sections at day 10 was scored (c) on a five-point scale (0–5) in a blind study. The criteria used for scoring include pulmonary oedema (pink material in air spaces), hemorrhage, necrotizing bronchiolitis (NB), interstitial mononuclear infiltration, and presence of bronchus-associated lymphoid tissue (BALT). Data are compilation of two independent experiments with eight mice for WT and seven for Zbtb32-/-. (d) At day 10 post-infection, lymphocytes from spleen and lungs were stimulated with NP396 or GP33 peptides followed by intracellular cytokine staining. The percentages ± SEM of IFNγ+ CD8+ T cells are depicted. Data are a representative of two independent experiments with three mice per genotype per experiment. (e) LCMV-clone 13 titers in spleen and liver were determined by plaque assay at day 10 post-infection. Data are representative of two independent experiments with five mice per genotype. (f,g) Congenically-marked WT and Zbtb32-/- P14 cells mixed 1:1 were co-transferred into recipients, which were infected with LCMV-clone 13. At day 14, P14 donor cells from surviving recipients were analyzed for their frequencies (f) and analyzed for expression of exhaustion markers as indicated (g). Plots show percentages ± SEM (g, upper panels) and the MFI of exhaustion marker expression (g, lower graphs) as indicated. Data are compilations from two independent experiments with five surviving of eight recipient mice.
Fig 6
Fig 6. ZBTB32 represses Eomes and Cd27 gene expression in CD8+ T cells by recruiting histone deacetylases 1 and 2.
WT or Zbtb32-/- P14 splenocytes were transferred into recipients, which were then infected with LCMV-Armstrong. At days 6, 8 and 10 post-infection, P14 cells were isolated and pooled from three mice per genotype for RNA isolation; chromatin was prepared at day 7 post-infection. (a) Eomes and Cd27 mRNA levels were examined by quantitative RT-PCR relative to Actb mRNA. (b) Schematic of Eomes and Cd27 gene loci showing position of specific (Amplicon 1; Amp1) and non-specific (Amplicon 2; Amp2) primers. In each case, Amp1 corresponds to putative ZBTB32 binding site. (c) The enrichment of ZBTB32 on Eomes and Cd27 genes by chromatin immunoprecipitation (ChIP). (d) The enrichment of HDAC1 and HDAC2 on Eomes and Cd27 genes by ChIP. (e) ChIP for Pol II, p300 or modified histone H3 at the Eomes and Cd27 loci. Data are a compilation of three independent experiments; error bars represent the SEM. Iso; isotype control antibody.
Fig 7
Fig 7. ZBTB32 and Blimp-1 bind cooperatively to target genes in activated CD8+ T cells.
(a) WT CD8+ T cells pooled from three mice were stimulated with αCD3 and αCD28 for 2 days with or without a cocktail of cytokines containing IL-2, IL-4 and IL-12. Cells were harvested and stained with a mouse IgG and a rabbit IgG as negative controls (Iso), αBlimp-1 and αHDAC2, or αBlimp-1 and αZBTB32, followed by the Duolink proximity ligation assay. Samples were counter-stained for nuclei (blue; DAPI). Yellow signals demonstrate close proximity of the two proteins and data are representative of three independent experiments (left panels) and the graph (right panel) is a compilation of data from three independent experiments, and error bars represent the SEM. (b) WT CD8+ T cells pooled from three mice were stimulated with αCD3/CD28 for 2 days with or without a cocktail of cytokines containing IL-2, IL-4 and IL-12. Cells were harvested for immunoprecipitation with αZBTB32 or an IgG control antibody (left panel), followed by Immunoblotting (IB) with αBlimp-1. The presence of Blimp-1 and ZBTB32 in the whole cell lysates were confirmed (right panels). Data are representative of three independent experiments. WCL; whole cell lysate. (c) WT P14 cells were isolated from three recipient mice at day 7 post-LCMV-Armstrong infection, and chromatin was prepared. Primary ChIP assays were performed with antibodies to Blimp-1. Eluates from αBlimp-1 immunoprecipitates were re-precipitated with αZBTB32 or rabbit IgG (Iso) antibodies. Each ChIP eluate was amplified by Q-PCR for the indicated regions of the Eomes (left graph) and Cd27 (right graph) genes. (d-f) WT, Zbtb32-/- or Prdm1-/- P14 cells were isolated from three recipient mice at day 7 post-LCMV-Armstrong infection, and chromatin was prepared. ChIP assays were performed with antibodies to Blimp1, ZBTB32 or mouse IgG plus rabbit IgG (Iso). ChIP eluates were amplified by Q-PCR for the indicated regions of Eomes (d, upper), Cd27 (d, lower) and Il2ra (e). (f) Schematic of Il2ra gene loci. In each case amplicon 1 (Amp1) corresponds to putative Blimp-1 or ZBTB32 binding site and amplicon 2 (Amp2) to a negative control region. All graphs shown are from a compilation of three independent experiments and error bars represent the SEM.
Fig 8
Fig 8. Non-redundant roles for ZBTB32 and Blimp-1 in anti-viral CD8+ T cell responses.
(a,b) WT P14 cells were isolated from three recipient mice at the indicated days post-LCMV-Armstrong infection. (a) Prdm1 mRNA was quantified. (b) Lysates were immunoblotted for Blimp-1 protein. Data are from three independent experiments; error bars represent SEM. (c,d) WT or Prdm1-/- P14 cells were isolated from three recipient mice at days 8 and 14 post-LCMV-Armstrong infection. Zbtb32 mRNA was quantified (c) and chromatin was prepared for ChIP assays with antibodies to Blimp1 or mouse IgG (Iso). ChIP eluates were amplified by Q-PCR for Zbtb32 gene. In each case amplicon 1 (Amp1) corresponds to putative Blimp-1 binding site and amplicon 2 (Amp2) to a negative control region. All graphs shown are from a compilation of three independent experiments and error bars represent the SEM. (e-h) LCMV-specific CD8+ T cells in splenocytes from WT, Zbtb32-/-, Prdm1-/- and Zbtb32-/- Prdm1-/- mice were analyzed at day 9 post-LCMV-Armstrong infection. Percentages ± SEM (left panels) and total numbers (graph at right) of LCMV-specific CD8+ T cells are depicted (e,f). LCMV-specific CD8+ T cells (g) and total CD8+CD44hi T cells (h) were analyzed for memory markers as indicated. Data are representative of two independent experiments with three mice per genotype per experiment.

Similar articles

Cited by

References

    1. Lauvau G, Boutet M, Williams TM, Chin SS, Chorro L. Memory CD8+ T Cells: Innate-Like Sensors and Orchestrators of Protection. Trends Immunol. Elsevier Ltd; 2016;37: 375–385. doi: 10.1016/j.it.2016.04.001 - DOI - PMC - PubMed
    1. Doering TA, Crawford A, Angelosanto JM, Paley MA, Ziegler CG, Wherry EJ. Network Analysis Reveals Centrally Connected Genes and Pathways Involved in CD8(+) T Cell Exhaustion versus Memory. Immunity. 2012;37: 1130–1144. doi: 10.1016/j.immuni.2012.08.021 - DOI - PMC - PubMed
    1. Best JA, Blair DA, Yang E, Mayya V, Doedens A, Dustin ML, et al. Transcriptional insights into the CD8(+) T cell response to infection and memory T cell formation. Nat Immunol. 2013;14: 404–412. doi: 10.1038/ni.2536 - DOI - PMC - PubMed
    1. Hu G, Chen J. A genome-wide regulatory network identifies key transcription factors for memory CD8. Nature Communications. Nature Publishing Group; 2013;4: 1–14. doi: 10.1038/ncomms3830 - DOI - PMC - PubMed
    1. Buchholz VR, Flossdorf M, Hensel I, Kretschmer L, Weissbrich B, Gräf P, et al. Disparate individual fates compose robust CD8+ T cell immunity. Science. American Association for the Advancement of Science; 2013;340: 630–635. doi: 10.1126/science.1235454 - DOI - PubMed