. 2017 Jul 2;8(10):1849-1864.
doi: 10.7150/jca.19858. eCollection 2017.

Metformin Inhibits Tumorigenesis and Tumor Growth of Breast Cancer Cells by Upregulating miR-200c but Downregulating AKT2 Expression

Affiliations

Metformin Inhibits Tumorigenesis and Tumor Growth of Breast Cancer Cells by Upregulating miR-200c but Downregulating AKT2 Expression

Jiali Zhang et al. J Cancer. .

Abstract

Background: Metformin has been reported to inhibit the growth of various types of cancers, including breast cancer. Yet the mechanisms underlying the anticancer effects of metformin are not fully understood. Growing evidence suggests that metformin's anticancer effects are mediated at least in part by modulating microRNAs, including miR-200c, which has a tumor suppressive role in breast cancer. We hypothesized that miR-200c has a role in the antitumorigenic effects of metformin on breast cancer cells. Methods: To delineate the role of miR-200c in the effects of metformin on breast cancer, plasmids containing pre-miR-200c or miR-200c inhibitor were transfected into breast cancer cell lines. The MDA-MB-231, BT549, MCF-7, and T-47-D cells' proliferation, apoptosis, migration, and invasion were assessed. The antitumor role of metformin in vivo was investigated in a MDA-MB-231 xenograft tumor model in SCID mice. Results: Metformin significantly inhibited the growth, migration, and invasion of breast cancer cells, and induced their apoptosis; these effects were dependent on both dose and time. Metformin also suppressed MDA-MB-231 tumor growth in SCID mice in vivo. Metformin treatment was associated with increased miR-200c expression and decreased c-Myc and AKT2 protein expression in both breast cancer cells and tumor tissues. Overexpression of miR-200c exhibited effects on breast cancer cells similar to those of metformin treatment. In contrast, inhibiting the expression of miR-200c increased the growth, migration, and invasion of MCF-7 and MDA-MB-231 cells. Conclusion: Metformin inhibits the growth and invasiveness of breast cancer cells by upregulation of miR-200c expression by targeting AKT2. These findings provide novel insight into the molecular functions of metformin that suggest its potential as an anticancer agent.

Keywords: AKT2; Metformin; breast cancer cell; miR-200c.


Conflict of interest statement

Competing Interests: The authors have declared that no competing interests exist.

Figures
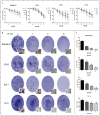
Figure 1
Figure 1
Metformin reduces proliferation and colony formation in breast cancer cells. (A) Cell proliferation was gauged by the CCK-8 assay when Breast cancer cells (MDA-MB-231, BT549, MCF-7, and T-47-D) were treated with metformin (Met) at various concentrations (2.5, 5, 10, 15, or 20 mM) for up to 48 h. Same volume of culture medium without metformin was added in the control group. (B-C) Colony formation was quantified 11 days after treatment with metformin (5, 10, or 20 mM) by counting the colonies formed. The control group was not given metformin treatment. *p<0.05, **p<0.01, ***p<0.001 compared with the controls.
Figure 2
Figure 2
Metformin induces apoptosis of breast cancer cells. (A) Apoptosis was quantified by Annexin V-APC assay and propidium iodide (PI) staining in breast cancer cells (MDA-MB-231, BT549, MCF-7, and T-47-D) with metformin (5, 10, or 20 mM) treatment for 48 h. Same volume of culture medium without metformin was added in the control group. (A) Early apoptotic cells (lower right, LR) and late apoptotic cells (upper right, UR) are shown. (B) Histograms represent quantification of the rate of apoptosis. *p<0.05, **p<0.01, ***p<0.001 compared with the controls.
Figure 3
Figure 3
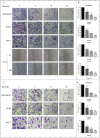
Metformin attenuates breast cancer cell migration and invasion. (A-B) Boyden transwell chamber assay (MDA-MB-231, BT549, MCF-7) or a wound healing assay (T-47-D) was used to determined cell migration in response to metformin (Met) (5, 10, or 20 mM) treatment for 48 h. The control group was not given metformin treatment. (C-D) The invasion assay (MDA-MB-231, BT549, MCF-7) also was performed in Boyden transwell chambers, in which the membranes were coated with diluted matrigel. After 48 h in the presence of various concentrations of metformin (0, 5, 10, or 20 mM), cells that passed through the membrane were counted. **p<0.01, ***p<0.001 compared with the controls.
Figure 4
Figure 4
MiR-200c is expressed in breast cancer cells and patient tumors, and metformin increases miR-200c expression in breast cancer cells. (A) Expression of miR-200c in breast cancer cell lines. (B) Total RNA was isolated and reverse-transcribed for qPCR to estimate the expression of miR-200c in cells following treatment with metformin (Met) for 48 h at the indicated concentrations (5, 10, or 20 mM). The control group was not given metformin treatment. (C) miR-200c overexpression was significantly associated with longer survival in a cohort of patients with breast cancer (GSE19536). *p<0.05, **p<0.01, ***p<0.001 compared with the controls.
Figure 5
Figure 5
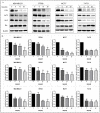
Metformin suppresses the expression of c-Myc, Bcl-2, and AKT2 proteins in breast cancer cells. (A) The levels of c-Myc, AKT2, Bcl-2 and Bax proteins were determined in breast cancer cells (MDA-MB-231, BT549, MCF-7 and T-47-D) by western blot following treatment with metformin (Met) for 48 h at the indicated concentrations (5, 10, or 20 mM). Same volume of culture medium without metformin was added in the control group. (B) Histograms represent quantification of the relative expression of c-Myc, Bcl-2, and AKT2 proteins. Metformin had no significant effect on the expression of Bax protein. *p<0.05, **p<0.01, ***p<0.001 compared with the controls.
Figure 6
Figure 6
MiR-200c overexpression reduces proliferation of breast cancer cells. (A) The expression of miR-200c was measured in MDA-MB-231 and MCF-7 cells after transfection with pre-miR-200c, miR-200c inhibitor, or negative control (NC) and transfected (MOCK) cells. The suppressive effect of miR-200c inhibitor on miR-200c expression was reversed by treatment with metformin (Met, 10 mM) for 48 h. (B) Upregulation of miR-200c in MDA-MB-231 and MCF-7 cells by Pre-miR-200c reduced cell proliferation while inhibition of miR-200c by miR-200c inhibitor increased cell proliferation relative to negative control (NC) and mock-treated (MOCK) cells. The OD values (450nm) represent relative cell proliferation rate. *p<0.05, **p<0.01, ***p<0.001 compared with the controls.
Figure 7
Figure 7
MiR-200c overexpression induces apoptosis of breast cancer cells. (A) Upregulation of miR-200c in MDA-MB-231 and MCF-7 cells by pre-miR-200c transfection induced cell apoptosis, while inhibition of miR-200c by miR-200c inhibitor reduced cell apoptosis relative to that in negative control (NC) and mock-treated (MOCK) cells. The suppressive effect of miR-200c inhibitor on apoptosis was reversed by treatment with metformin (Met, 10 mM) for 48 h. (B) Histograms represent quantification of the apoptosis rate. *p<0.05, **p<0.01, ***p<0.001 compared with the controls.
Figure 8
Figure 8
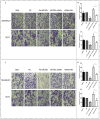
MiR-200c overexpression inhibits breast cancer cell migration and invasion. Upregulation of miR-200c in MDA-MB-231 and MCF-7 cells by transfection of pre-miR-200c decreased cell migration (A-B) and invasion (C-D), while inhibition of miR-200c by miR-200c inhibitor increased cell migration (A-B) and invasion (C-D) relative to negative control (NC) and mock-treated cells (MOCK). The stimulating effects of miR-200c inhibitor on migration and invasion were reversed by treatment with metformin (Met, 10 mM) for 48 h. *p<0.05, **p<0.01, ***p<0.001 compared with the controls.
Figure 9
Figure 9
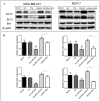
MiR-200c inhibits expression of Bcl-2 and AKT2 protein in breast cancer cells. (A) Upregulation of miR-200c in MDA-MB-231 and MCF-7 by transfection of pre-miR-200c reduced expression of Bcl-2 and AKT2 proteins, while inhibition of miR-200c by miR-200c inhibitor increased expression of Bcl-2 and AKT2 protein relative to negative control (NC) and untransfected (MOCK) cells. The stimulating effect of miR-200c inhibition on AKT2 and Blc-2 proteins was reversed by treatment with metformin (Met, 10 mM) for 48 h. (B) Histograms represent quantification of the relative expression of each protein in the two cell types. *p<0.05, **p<0.01, ***p<0.001 compared with controls.
Figure 10
Figure 10
Metformin inhibits breast cancer xenograft growth in SCID mice. Xenograft tumors were generated by subcutaneous implantation of MDA-MB-231 cells (5 mice/group). Fifteen days post injection, the animals were received metformin treatment (125 mg/kg/dose [Met 125]) or 250 mg/kg/dose [Met 250], respectively) every 2 days and continued for 30 days. (A) MDA-MB-231 xenograft tumors were assessed every 6 days during treatment; mean tumor volumes over time are shown. The xenograft tumor-bearing mice (B) and dissected tumors (C) are shown. (D) Average weights of the excised tumors by treatment group were determined.*p<0.05, **p<0.01, compared with the controls.
Figure 11
Figure 11
Metformin increases miR-200c and reduces expression of c-Myc and AKT2 proteins in breast cancer xenografts in vivo. (A) The expression of c-Myc in tumor tissues from mice treated with vehicle (control), metformin 125 mg/kg [Met 125], or metformin 250 mg/kg [Met 250] was determined by immunohistochemical staining; representative images are shown (400× magnification). The arrow is pointing at c-Myc positive cells. The mean optical density (integrated optical density sum/area sum) of c-Myc positive cells was determined in the breast cancer tumor tissue and indicated under each image. (B) Expression of miR-200c was quantified by qPCR in tumor samples from each treatment group. (C) c-Myc and AKT2 protein levels were quantified by Western blot in tumor samples from each treatment group. *p<0.05, **p<0.01, ***p<0.001 compared with the controls.

Similar articles

Cited by

References

    1. Gonzalez N, Prieto I, Del Puerto-Nevado L. et al. 2017 update on the relationship between diabetes and colorectal cancer: epidemiology, potential molecular mechanisms and therapeutic implications. Oncotarget. 2017 doi: 10.18632/oncotarget.14472. - PMC - PubMed
    1. Yu X, Mao W, Zhai Y. et al. Anti-tumor activity of metformin: from metabolic and epigenetic perspectives. Oncotarget. 2016 doi: 10.18632/oncotarget.13639. - PMC - PubMed
    1. Tseng CH. Rosiglitazone reduces breast cancer risk in Taiwanese female patients with type 2 diabetes mellitus. Oncotarget. 2016 doi: 10.18632/oncotarget.13824. - PMC - PubMed
    1. Chae YK, Arya A, Malecek MK. et al. Repurposing metformin for cancer treatment: current clinical studies. Oncotarget. 2016;7(26):40767–80. - PMC - PubMed
    1. Coyle C, Cafferty FH, Vale C. et al. Metformin as an adjuvant treatment for cancer: a systematic review and meta-analysis. Ann Oncol. 2016;27(12):2184–95. - PMC - PubMed