. 2017 Oct 15;77(20):5614-5627.
doi: 10.1158/0008-5472.CAN-17-1323. Epub 2017 Aug 17.

Therapeutic Effects of XPO1 Inhibition in Thymic Epithelial Tumors

Affiliations

Therapeutic Effects of XPO1 Inhibition in Thymic Epithelial Tumors

Fabio Conforti et al. Cancer Res. .

Abstract

Exportin 1 (XPO1) mediates nuclear export of many cellular factors known to play critical roles in malignant processes, and selinexor (KPT-330) is the first XPO1-selective inhibitor of nuclear export compound in advanced clinical development phase for cancer treatment. We demonstrated here that inhibition of XPO1 drives nuclear accumulation of important cargo tumor suppressor proteins, including transcription factor FOXO3a and p53 in thymic epithelial tumor (TET) cells, and induces p53-dependent and -independent antitumor activity in vitro Selinexor suppressed the growth of TET xenograft tumors in athymic nude mice via inhibition of cell proliferation and induction of apoptosis. Loss of p53 activity or amplification of XPO1 may contribute to resistance to XPO1 inhibitor in TET. Using mass spectrometry-based proteomics analysis, we identified a number of proteins whose abundances in the nucleus and cytoplasm shifted significantly following selinexor treatment in the TET cells. Furthermore, we found that XPO1 was highly expressed in aggressive histotypes and advanced stages of human TET, and high XPO1 expression was associated with poorer patient survival. These results underscore an important role of XPO1 in the pathogenesis of TET and support clinical development of the XPO1 inhibitor for the treatment of patients with this type of tumors. Cancer Res; 77(20); 5614-27. ©2017 AACR.


Conflict of interest statement

Disclosure of Potential Conflicts of Interest

No potential conflicts of interest were disclosed.

Figures
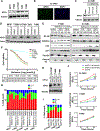
Figure 1.
Figure 1.
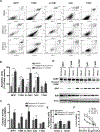
XPO1 inhibition induces nuclear accumulation of its cargo proteins and inhibits cell-cycle progression and proliferation of TET cells. A, Western blot detection of XPO1 in TET cell lines. B, Detection of XPO1 in IU-TAB1 cells by immunofluorescence staining (XPO1, green; DAPI, blue). C and D, Western blot detection of XPO1 in IU-TAB1 cells treated with increasing concentrations of selinexor (C), and in other TET cell lines, treated with 1 μmol/L of selinexor for 24 hours (D). DMSO was used as the treatment control. E, Western blot analyses of the indicated proteins in the nuclear (NE) and cytoplasmic extraction (CE) of T1889 and IU-TAB1 cells treated with DMSO or selinexor (1 μmol/L). Tubulin and Histone H3 were used to show equal protein loading and purity of cytoplasmic and nuclear fractions. F, Cell viability of TET cell lines treated with increasing concentrations of selinexor for 72 hours, and the IC50 of selinexor and 95% confidence interval (95% CI) for each cell line. NR*, not reached. G, Flow-cytometric analysis of TET cells stained with PI after 24 hours’ treatment with DMSO or selinexor (0.5 or 1 μmol/L). H, Western blot analysis of XPO1 knockdown by siRNA. Tubulin was used as a loading control. siCTRL, scramble siRNA; siXPO1, XPO1 siRNA. I, Cell-cycle analysis of IU-TAB1, T1889, and T1682 cells treated with siCTRL or siXPO1 (40 nmol/L) for 48 hours. J, Proliferation of IU-TAB1, T1889, and T1682 cells after treatment with siCTRL or siXPO1 for 48, 72, and 96 hours. Results are expressed as relative light units (RLU) and represent mean values ± SD of triplicates. *, P < 0.05; **, P < 0.01.
Figure 2.
Figure 2.
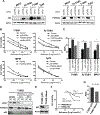
Selinexor induces apoptosis in sensitive TET cells but hardly in normal thymic epithelial cells. A, Apoptosis of TET cells was determined by flow cytometry-based Annexin V/PI apoptosis assay 72 hours after treatment with DMSO or selinexor (0.5 or 1 μmol/L). Representative contour plots from each experiment are shown. B, Quantification of apoptotic cells. C, Assessment of caspase-3 and −7 catalytic activity 48 hours after DMSO or selinexor treatment. Data are expressed as fold of fluorescence units of selinexor-treated samples relative to that of DMSO and represent mean values ± SD of triplicates. *, P < 0.05; **, P < 0.01. D, Western blot detection of PARP, cleaved PARP, BAX, and BIM in the indicated TET cells treated with DMSO or selinexor (1 μmol/L) for 24 hours. β-Actin was used as the loading control. E, Annexin V/PI apoptosis assay of normal thymic epithelial cells TEC41.2 and TEC81 after treatment with/without selinexor for 72 hours. F, Viability of TEC41.2, TEC81, and IU-TAB1 cells after treatment with increasing concentrations of selinexor for 72 hours. Data represent mean ± SD of triplicates.
Figure 3.
Figure 3.
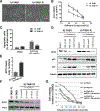
Selinexor confers p53-dependent and -independent antitumor activity in TET cells. A, Western blot detection of p53 and FOXO3a in the indicated TET cells after siRNA knockdown. B, Viability of T1889, IU-TAB1, MP57, and Ty82 cells treated with increasing concentrations of selinexor with/without control siRNA, p53 siRNA, and/or FOXO3a siRNA for 72 hours. C, Comparison of the AUC between cells treated with selinexor with and without p53 and/or FOXO3a siRNAs. Data represent mean values ± SD of triplicates. **, P < 0.01. D, Western blot detection of XPO1, FOXO3a, and p53 in the cytoplasmic (CE) and nuclear extraction (NE) of T1682 cells treated with DMSO or selinexor for the indicated times. E, Western blot confirmation of ectopic p53 expression in T1682 cells transfected with pIRES2-EGFP-p53 vector. Cells transfected with pIRES2-EGFP empty vector (Mock) were used as the control. F, Cell viability of Mock- or p53-transfected T1682 cells treated with increasing concentrations of selinexor for 72 h. IC50 concentrations were determined using GraphPad Prism program. G, Comparison of AUCs between p53- and Mock-transfected T1682 cells treated with selinexor. Data represent mean values ± SD of triplicates. **, P < 0.01.
Figure 4.
Figure 4.
Amplification of XPO1 renders acquired resistance of IU-TAB1 cells to selinexor. A, Morphology of parental IU-TAB1 cells and the selinexor-resistant derivatives (IU-TAB1-R). B, Viability of IU-TAB1 and IU-TAB1-R cells treated with increasing concentrations of selinexor for 72 hours. C, Apoptotic rates of IU-TAB1 and IU-TAB1-R cells treated with DMSO or selinexor (0.5 μmol/L) for 72 hours, analyzed by flow cytometry-based Annexin V/PI apoptosis assay. D, Western blot detection of XPO1, p53, and p27 in IU-TAB1 and IU-TAB1-R cells treated with DMSO or the indicated concentrations of selinexor for 24 hours. E, XPO1 gene copy number quantification in IU-TAB1 and IU-TAB1-R cells by real-time PCR analysis (P = 0.001). F, Western blot evaluation of XPO1 knockdown in IU-TAB1-R cells after exposure to increasing concentrations of XPO1 siRNA for 24 hours. G, Viability of IU-TAB1-R cells treated with siCTRL or siXPO1 (10 or 20 nmol/L) in the presence of increasing concentrations of selinexor for 72 hours. IU-TAB1 cells were also assayed for drug sensitivity comparisons.
Figure 5.
Figure 5.
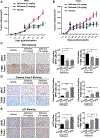
Selinexor exhibits in vivo antitumor activity against TET xenograft tumors. A and B, Growth curves of MP57 and T1889 xenograft tumors in athymic nude mice treated with vehicle or selinexor (10 mg/kg or 15 mg/kg) three times a weeks for 2 weeks. Arrows, when treatment started. Data represent the mean ± SD of tumor volumes (n = 8). *, P < 0.05; **, P < 0.01. C–E, IHC staining of Ki67 (C), cleaved caspase-3 (D), and p27 in MP57 and T1889 tumors (E) after treatment with/without selinexor for 2 weeks. Representative IHC images are shown in the left panels, and quantification of IHC staining results is shown on the right. Histograms represent mean ± SD of percentage of IHC positive cells in three tumors from each group. *, P < 0.05; **, P < 0.01; ***, P < 0.001.
Figure 6.
Figure 6.
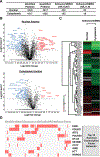
SILAC-based quantitative proteomics of nuclear and cytoplasmic fractions in IU-TAB1 cells affected by selinexor. A, Number of proteins identified and quantified from nuclear and cytoplasmic subcellular fraction of IU-TAB1 cells and the number of proteins with 1.5-fold change upon selinexor treatment (H/L >1.5 or H/L <0.67). B, Statistical analysis of the dynamic changes of the nuclear and cytoplasmic proteins affected by selinexor. Volcano plot represent the difference of protein changes in nucleus or cytoplasm between DMSO and selinexor treatment. Log2 ratios of the fold changes are plotted versus −log10 of the P values derived from a t test. Proteins with a minimum of 1.5-fold change combined with a P value smaller than 0.05 are considered significant. Blue dots, downregulated proteins; red dots, upregulated proteins. C, Hierarchical clustering of all the quantified transcription factors based on the ratios of drug treatment. Columns represent different subcellular fractions. Rows represent quantified transcription factors. D, Top 10 enriched transcription factor protein–protein interaction networks analyzed by Clustergram. Red cells in the matrix indicate significantly changed proteins that interact with the corresponding transcription factor.
Figure 7.
Figure 7.
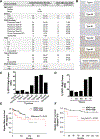
High XPO1 expression is associated with aggressive histotypes and advanced stages of human TETs as well as poorer patient survival. A, Characteristic of patient population and XPO1 expression statuses. B, Representative images of XPO1 IHC staining in different histotypes of thymomas and thymic carcinomas. C, Percentage of XPO1-high cases relative to the cases of each histological subtype. For comparison, normal thymic tissues were also examined. D, Percentage of XPO1-high cases relative to the analyzed cases of TETs in each corresponding stage. E and F, Kaplan–Meier patient survival curves plotted according to the XPO1 expression levels (XPO1-high versus XPO1-low) in the TETs at all stages (E) or at early stages (I–II; F).

Similar articles

Cited by

References

    1. Weinstein IB, Joe AK. Mechanisms of disease: oncogene addiction—a rationale for molecular targeting in cancer therapy. Nat Clin Pract Oncol 2006;3:448–57. - PubMed
    1. Hanahan D, Weinberg RA. Hallmarks of cancer: the next generation. Cell 2011;144:646–74. - PubMed
    1. Tran EJ, King MC, Corbett AH. Macromolecular transport between the nucleus and the cytoplasm: advances in mechanism and emerging links to disease. Biochim Biophys Acta 2014;1843:2784–95. - PMC - PubMed
    1. Tan DS, Bedard PL, Kuruvilla J, Siu LL, Razak AR. Promising SINEs for embargoing nuclear–cytoplasmic export as an anticancer strategy. Cancer Discov 2014;4:527–37. - PubMed
    1. Kudo N, Matsumori N, Taoka H, Fujiwara D, Schreiner EP, Wolff B, et al. Leptomycin B inactivates CRM1/exportin 1 by covalent modification at a cysteine residue in the central conserved region. Proc Natl Acad Sci U S A 1999;96:9112–7. - PMC - PubMed

MeSH terms

Supplementary concepts