Review
. 2017 Oct;13(10):629-646.
doi: 10.1038/nrneph.2017.107. Epub 2017 Aug 14.

Mitochondrial energetics in the kidney

Affiliations
Review

Mitochondrial energetics in the kidney

Pallavi Bhargava et al. Nat Rev Nephrol. 2017 Oct.

Abstract

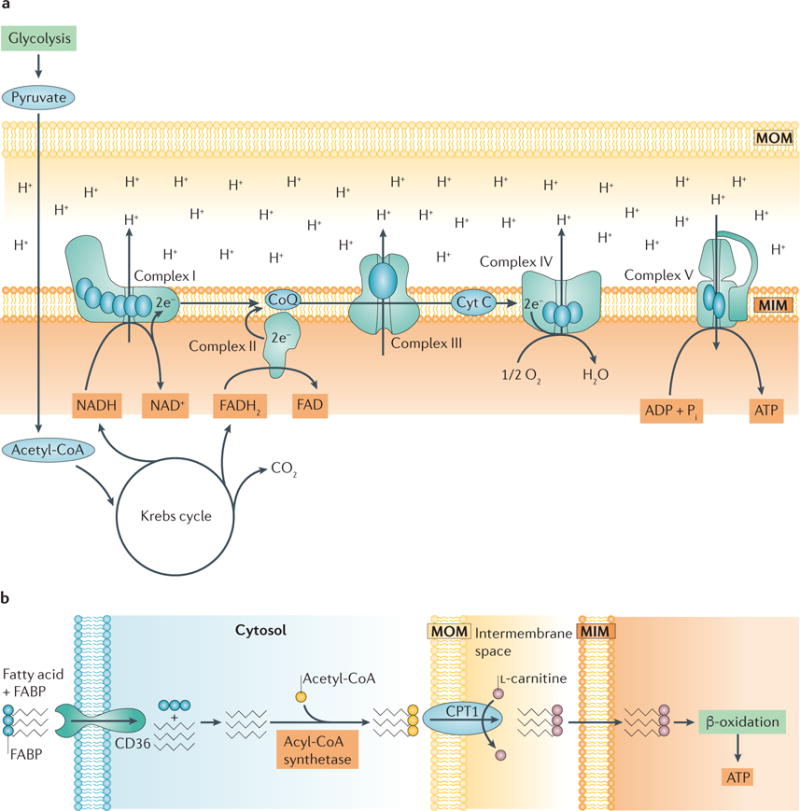
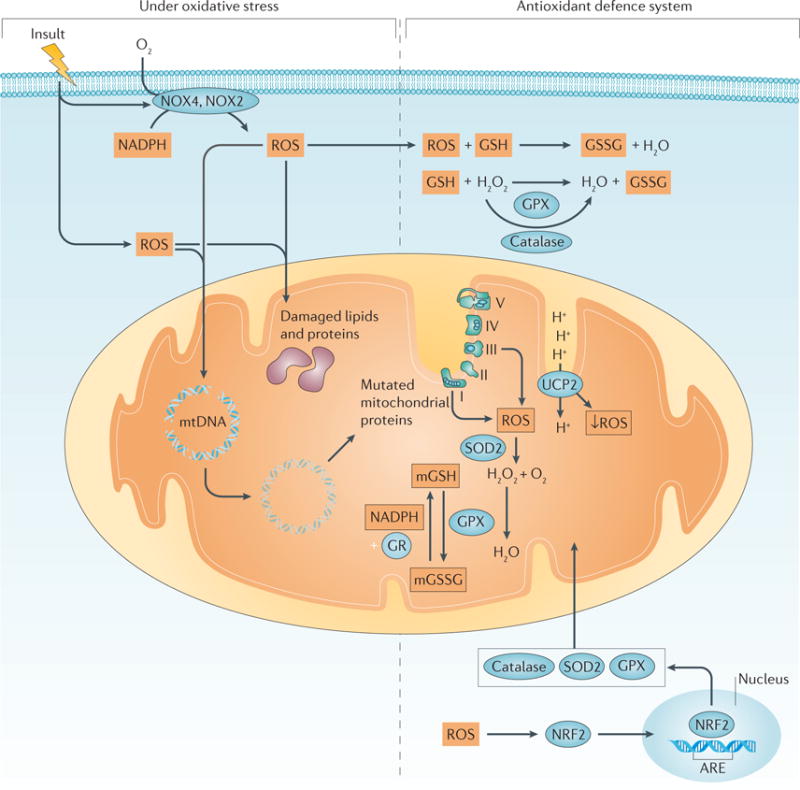
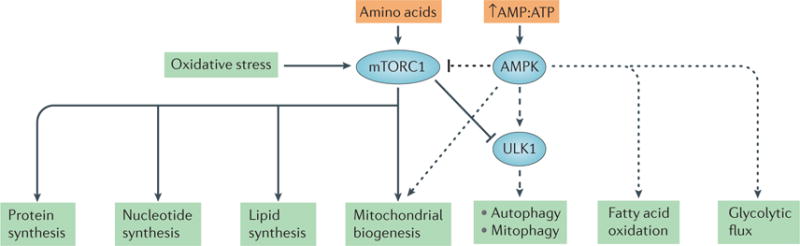
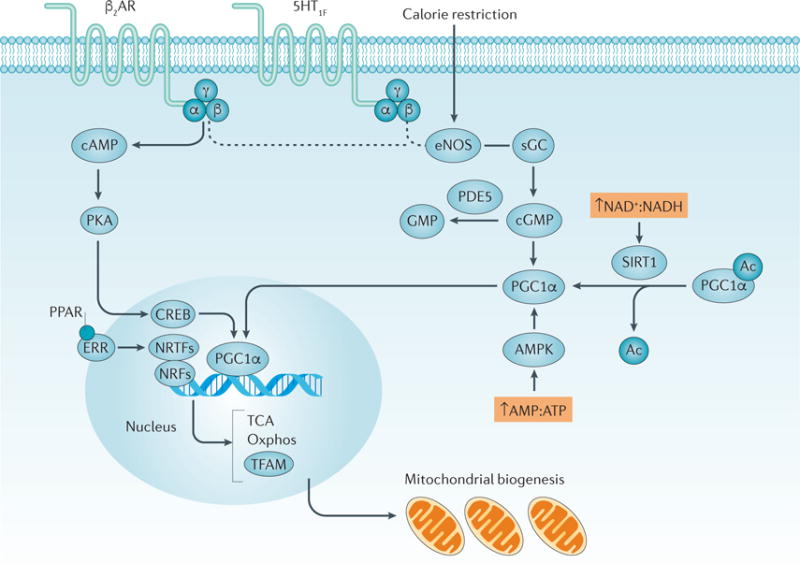
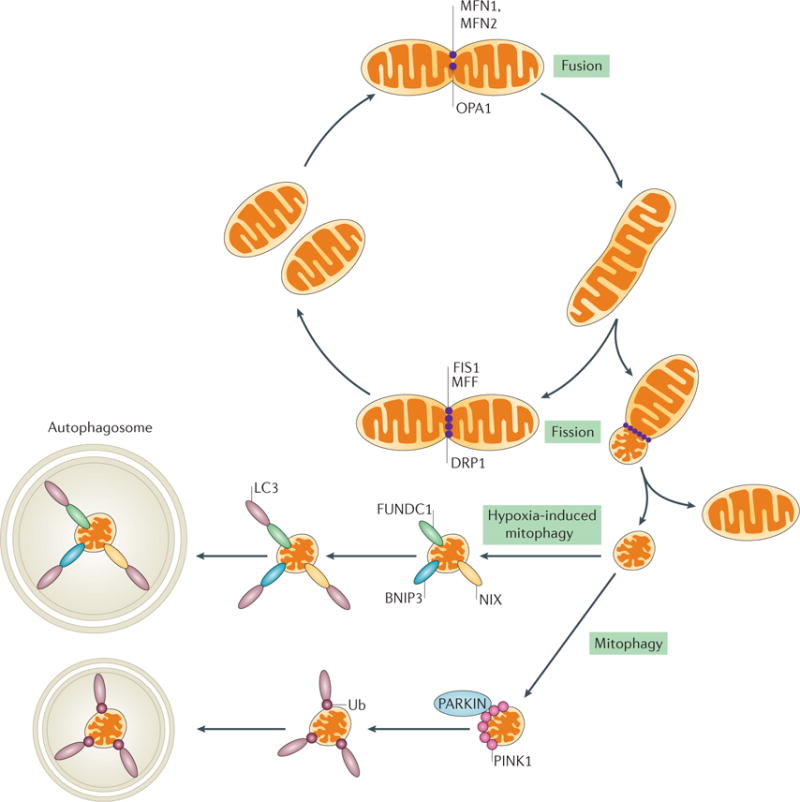
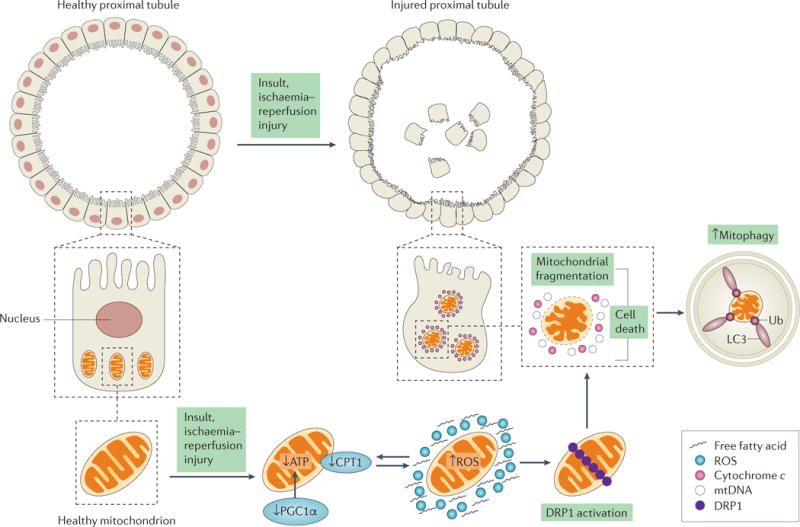
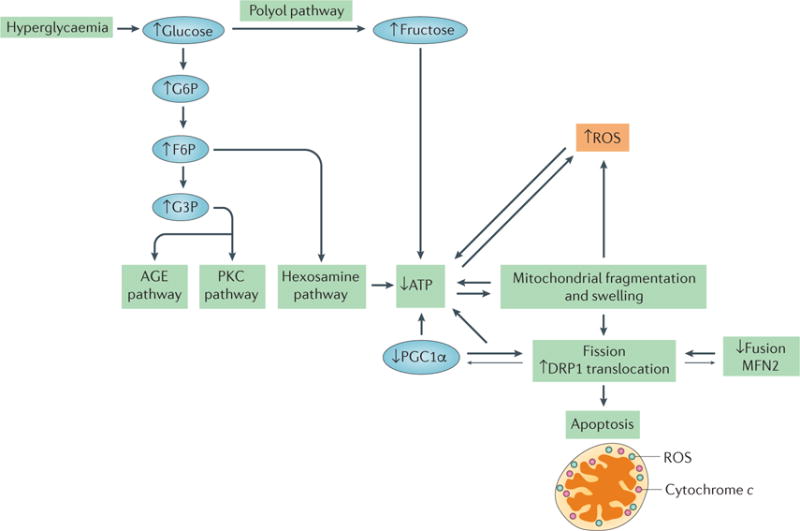
The kidney requires a large number of mitochondria to remove waste from the blood and regulate fluid and electrolyte balance. Mitochondria provide the energy to drive these important functions and can adapt to different metabolic conditions through a number of signalling pathways (for example, mechanistic target of rapamycin (mTOR) and AMP-activated protein kinase (AMPK) pathways) that activate the transcriptional co-activator peroxisome proliferator-activated receptor-γ co-activator 1α (PGC1α), and by balancing mitochondrial dynamics and energetics to maintain mitochondrial homeostasis. Mitochondrial dysfunction leads to a decrease in ATP production, alterations in cellular functions and structure, and the loss of renal function. Persistent mitochondrial dysfunction has a role in the early stages and progression of renal diseases, such as acute kidney injury (AKI) and diabetic nephropathy, as it disrupts mitochondrial homeostasis and thus normal kidney function. Improving mitochondrial homeostasis and function has the potential to restore renal function, and administering compounds that stimulate mitochondrial biogenesis can restore mitochondrial and renal function in mouse models of AKI and diabetes mellitus. Furthermore, inhibiting the fission protein dynamin 1-like protein (DRP1) might ameliorate ischaemic renal injury by blocking mitochondrial fission.


Conflict of interest statement

Competing interests statement

The authors declare no competing interests.

Figures

Figure 1
Figure 1. ATP production in the kidney
a | The electron transport chain (ETC). A functioning ETC transforms reducing equivalents from NADH and FADH2 to produce NAD+ and FAD+, respectively. The electrons (e)that are produced travel through the complexes of the ETC and are ultimately accepted by oxygen at complex IV. As electrons are transferred from complex to complex, protons (H+) are actively pumped out from complexes I, III, and IV into the intermembrane space, maintaining the membrane potential and driving the production of ATP by ATP synthase (also known as complex V). b | Fatty acid transport and activation in renal proximal tubule cells. Proximal tubules require large amounts of ATP to drive ion transport and therefore rely on aerobic respiration, the most efficient mechanism for producing ATP. Fatty acids are a main source of energy for proximal tubules because more ATP can be produced from one molecule of palmitate than from one molecule of glucose. Fatty acids bound to fatty acid-binding proteins (FABP) are transported into the proximal tubule cell via platelet glycoprotein 4 (also known as CD36) and activated by the addition of acetyl-CoA in the cytosol via acyl-CoA synthetase. Activated fatty acids are transported into mitochondria via carnitine O-palmitoyltransferase 1 (CPT1), which exchanges their acyl-CoA group for L-carnitine, whereupon they undergo β-oxidation to produce ATP. CoQ, coenzyme Q; Cyt C, cytochrome c; MIM, mitochondrial inner membrane; MOM, mitochondrial outer membrane; Pi, inorganic phosphate.
Figure 2
Figure 2. Oxidative stress and the antioxidant defence system
Insults can increase the production of reactive oxygen species (ROS) in the cytosol and mitochondria. NADPH oxidase 2 (NOX2) and NOX4 can also contribute to the production of ROS. The production of ROS can cause breaks in mitochondrial DNA (mtDNA) and damage lipids and proteins. Damaged mtDNA can produce aberrant mitochondrial proteins and prevent mitochondrial protein synthesis, whereas damaged lipids and proteins result in impaired mitochondrial function, leading to further increases in mitochondrial ROS. ROS also activate nuclear factor erythroid 2-related factor 2 (NRF2), which translocates to the nucleus and binds to antioxidant-responsive elements (AREs) to activate the transcription of genes encoding oxidant-neutralizing enzymes, such as mitochondrial superoxide dismutase 2 (SOD2), glutathione peroxidase (GPX) and catalase. SOD2 reduces superoxide anions to hydrogen peroxide (H2O2) and oxygen (O2). Catalase, found in the cytoplasm, and GPX, located in the cytoplasm and mitochondria, reduce H2O2 to water (H2O). GPX also oxidizes glutathione (GSH), resulting in glutathione disulfide (GSSG) as a byproduct of reducing hydrogen peroxide to water. GSSG in mitochondria (mGSSG) is converted back to GSH by glutathione reductase (GR) in a process that requires the presence of NADPH. The activity of the mitochondrial uncoupling protein 2 (UCP2) is increased, dissipating the proton motive force and decreasing ROS production. mGSH, mitochondrial GSH. The electron transport chain complexes I–V are indicated as I, II, III, IV and V.
Figure 3
Figure 3. Crosstalk between two nutrient-sensing pathways
Mechanistic target of rapamycin complex 1 (mTORC1) and AMP-activated protein kinase (AMPK) have key roles in regulating mitochondrial biogenesis and mitophagy. mTORC1 is responsible for triggering anabolic pathways, such as the synthesis of proteins, nucleotides and lipids, as well as mitochondrial biogenesis. AMPK activates catabolic pathways, including autophagy, mitophagy, fatty acid oxidation and glycolysis. AMPK can stimulate mitochondrial biogenesis (dotted arrow). However, in response to stimuli such as nutrient deprivation, AMPK can inhibit mTORC1 (dotted inhibitory line) and phosphorylate ULK1 to activate mitophagy (dashed arrow). Together these two signalling pathways maintain cell function and sustain mitochondrial energetics in response to stimuli such as hypoxia, oxidative stress and energy depletion.
Figure 4
Figure 4. Activation and regulation of mitochondrial biogenesis
A complex network of pathways regulate mitochondrial biogenesis. Activation of peroxisome proliferator-activated receptor-γ co-activator 1α (PGC1α) in the cytosol causes its translocation to the nucleus and the transcription of genes (including that encoding mitochondrial tricarboxylic acid (TCA) cycle and mitochondrial biogenesis. TFAM aids in the transcription of genes that are encoded by mitochondrial DNA. The activation of G protein-coupled receptors (GPCRs), such as the β2 adrenergic receptors (β2AR) and 5-hydroxytryptamine receptor 1F (5-HT1F), leads to the dissociation of heterotrimeric G proteins composed of Gα, Gβ and Gγ subunits and the subsequent activation of protein kinase A and endothelial nitric oxide synthase (eNOS). The pathway from GPCRs to eNOS is still under investigation, as indicated by the dashed line. eNOS stimulates soluble guanylyl cyclase (sGC) to form cyclic guanosine monophosphate (cGMP), which in turn activates PGC1α. A number of compounds can activate nuclear receptors such as peroxisome proliferator-activated receptors (PPARs) and oestrogen- related receptors (ERRs) and induce mitochondrial biogenesis. Once activated, these nuclear receptors can act as transcriptional co-activators (labelled in the figure as nuclear receptor transcription factors (NRTFs)), with PGC1α to stimulate mitochondrial biogenesis. Other transcription factors, including nuclear respiratory factor 1 (NRF1) and NRF2, can also directly bind to PGC1α to induce mitochondrial biogenesis. Stimuli, such as caloric restriction, can activate eNOS, increasing the production of cGMP and leading to the activation of PGC1α. The activity of sirtuin 1 (SIRT1) is increased in the presence of a high ratio of NAD+ to NADH concentrations, leading to the activation of PGC1α. High AMP:ATP ratios also activate AMP-activated protein kinase (AMPK), activating PGC1α by phosphorylation. In all of these cases, the activation of PGC1α stimulates mitochondrial biogenesis. Ac, acetyl; PDE5, cGMP-specific 3ʹ,5ʹ-cyclic phosphodiesterase; PKA, protein kinase A; sGC, soluble guanylyl cyclase.
Figure 5
Figure 5. Mitochondrial dynamics: fission, fusion and mitophagy
Mitochondria are dynamic organelles that need to maintain their morphology for the optimal production of ATP under different metabolic conditions and as part of a healthy network of mitochondria. Fission and fusion are two processes that are necessary for the maintenance of mitochondria morphology. Mitochondria fuse together via mitofusin 1 (MFN1) and MFN2 (outer membrane fusion) and the activation of dynamin-like 120 kDa (OPA1) (inner membrane fusion). Fusion can occur to maintain ATP production or to redistribute mitochondrial proteins. Fission can isolate depolarized mitochondrion that might not contribute to the healthy network of mitochondria. The activation of fission causes the oligomerization of dynamin 1-like protein (DRP1) on the mitochondrial outer membrane, where it is bound to receptors (namely mitochondrial fission 1 (FIS1) and mitochondrial fission factor (MFF)), forming a ring-like structure that mediates the separation of mitochondria. The network also isolates dysfunctional mitochondria for degradation by mitophagy via a well-studied PTEN-induced putative kinase 1 (PINK1)– PARKIN mechanism. Under adverse conditions such as hypoxia, however, mitochondria will be removed by a FUN14 domain-containing protein 1 (FUNDC1) or BCL2/adenovirus E1B 19 kDa protein-interacting protein 3 (BNIP3) and NIP3-like protein (NIX)-dependent mechanism of mitophagy. LC3, microtubule-associated protein 1 light chain 3; Ub, ubiquitin.
Figure 6
Figure 6. Changes in mitochondrial morphology lead to tubular damage in acute kidney injury
A healthy proximal tubule consists of an intact brush border with tight junctions and contains a network of mitochondria to maintain its function. After ischaemia–reperfusion injury (IRI), changes in mitochondrial function and morphology lead to mitochondrial dysfunction, and eventually to injured proximal tubules. In the early stages of acute kidney injury (AKI), a number of events may happen concurrently to cause a decrease in ATP production. These events include a decrease in the expression of carnitine O-palmitoyltransferase 1 (CPT1) (causing fatty acid accumulation and decreasing β-oxidation for ATP production), a decrease in the expression of peroxisome proliferator-activated receptor-γ co-activator 1α (PGC1α) and an increase in the production of reactive oxygen species (ROS) (bidirectional arrows). Together, these events can trigger the activation and accumulation of dynamin 1-like protein (DRP1) on the mitochondrial outer membrane, promoting mitochondrial fragmentation and eventually cell death. The release of cytochrome c and mitochondrial DNA (mtDNA) from dysfunctional mitochondria causes an increase in mitophagy. Mitochondrial dysfunction can induce cell death in injured proximal tubules, resulting in the loss of nuclei and tight junctions and in disrupted brush borders. Apoptotic or necrotic tubules can lead to cell sloughing, as seen in the centre of the tubule.
Figure 7
Figure 7. Factors contributing to mitochondrial dysfunction in diabetic nephropathy
Hyperglycaemia is the primary contributing factor to mitochondrial dysfunction in diabetic nephropathy. An increase in glucose level results in an increase in glycolysis, in turn activating the advanced glycation end product (AGE) pathway, the protein kinase C (PKC) pathway and the hexosamine pathway, which results in a decrease in ATP levels. Hyperglycaemia also activates the polyol pathway, which increases fructose levels and, consequently, decreases ATP levels. Mitochondrial fragmentation and swelling is observed in early diabetic nephropathy, leading to an increase in fission and the production of reactive oxygen species (ROS). The correlations between increased mitochondrial fragmentation and decreased ATP, and between ROS production and decreased ATP, are interdependent. Whether one causes the other is unclear, as depicted by the bidirectional arrows. Decreases in the levels of mitofusin 2 (MFN2) and peroxisome proliferator-activated receptor-γ co-activator 1α (PGC1α) correlate with, and might contribute to, the increase in mitochondrial fission observed in diabetic nephropathy, as indicated by the larger arrows pointing towards increased mitochondrial fission. Decreases in mitochondrial energetics that are caused by changes in mitochondrial morphology and hyperglycaemia lead to apoptosis in diabetic nephropathy. F6P, fructose-6-phosphate; G6P, glucose-6-phosphate; G3P, glyceraldehyde-3-phosphate.

Similar articles

Cited by

References

    1. Wang ZM, et al. Specific metabolic rates of major organs and tissues across adulthood: evaluation by mechanistic model of resting energy expenditure. Am J Clin Nutr. 2010;92:1369–1377. - PMC - PubMed
    1. Pagliarini DJ, et al. A mitochondrial protein compendium elucidates complex I disease biology. Cell. 2008;134:112–123. - PMC - PubMed
    1. O’Connor PM. Renal oxygen delivery: matching delivery to metabolic demand. Clin Exp Pharmacol Physiol. 2006;33:961–967. - PubMed
    1. Soltoff SP. ATP and the regulation of renal cell function. Annu Rev Physiol. 1986;48:9–31. - PubMed
    1. Holechek MJ, et al. Glomerular filtration: an overview. Nephrol Nurs J. 2003;30:285–290. quiz 281–282. - PubMed