. 2017 Sep 7;21(3):319-331.e8.
doi: 10.1016/j.stem.2017.07.009. Epub 2017 Aug 10.

Modeling of TREX1-Dependent Autoimmune Disease using Human Stem Cells Highlights L1 Accumulation as a Source of Neuroinflammation

Affiliations

Modeling of TREX1-Dependent Autoimmune Disease using Human Stem Cells Highlights L1 Accumulation as a Source of Neuroinflammation

Charles A Thomas et al. Cell Stem Cell. .

Abstract

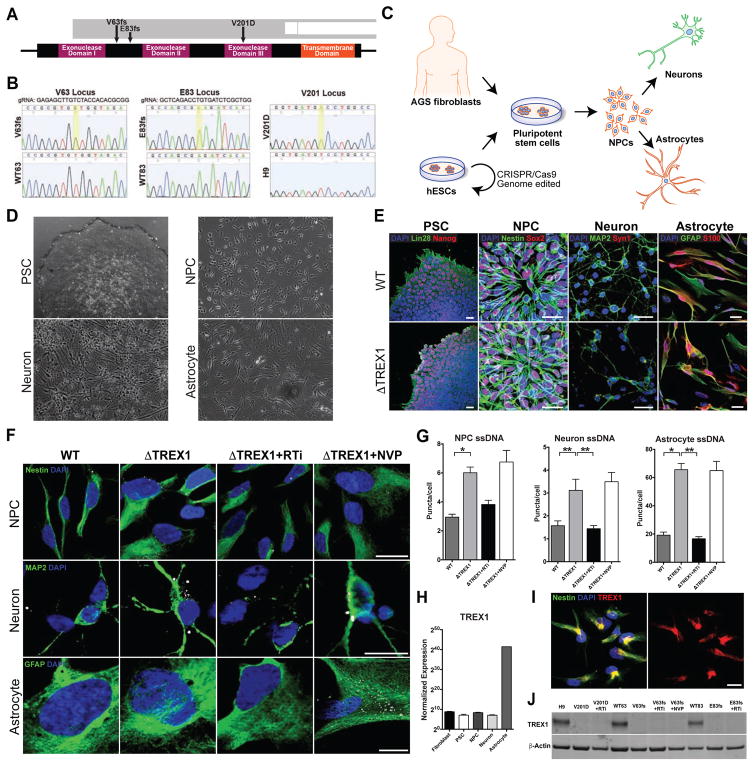
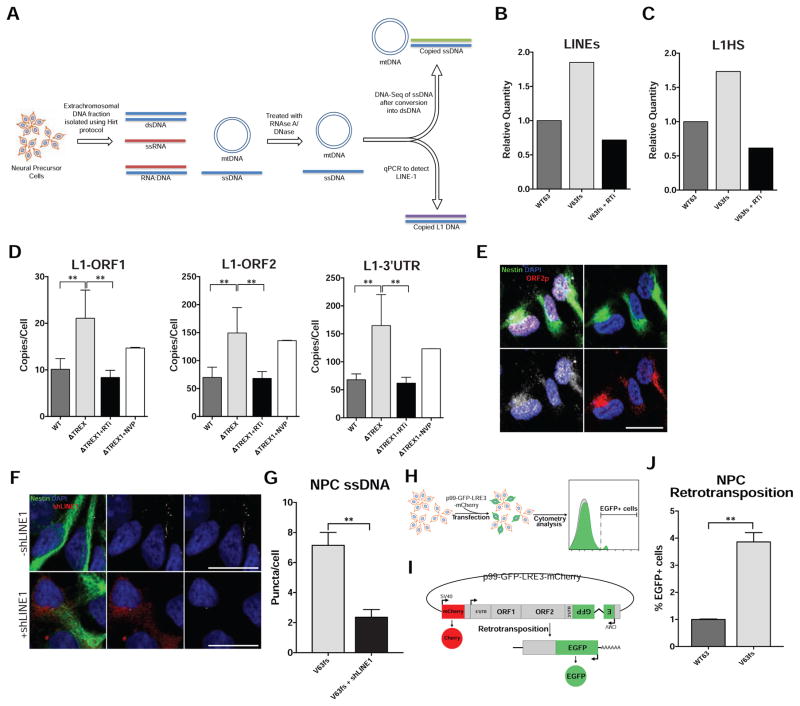
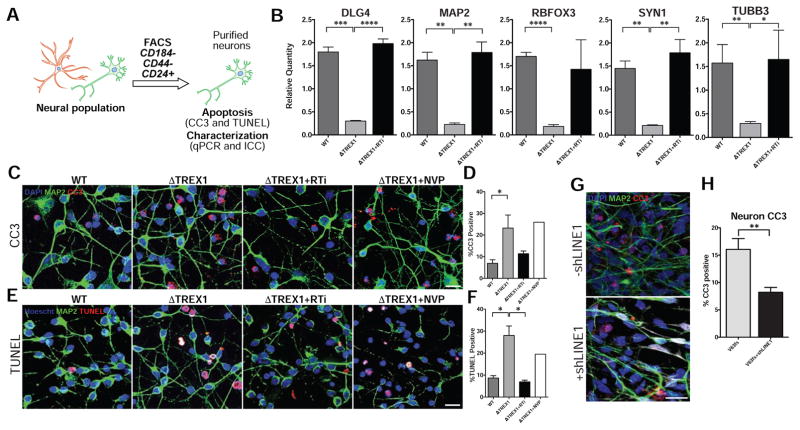
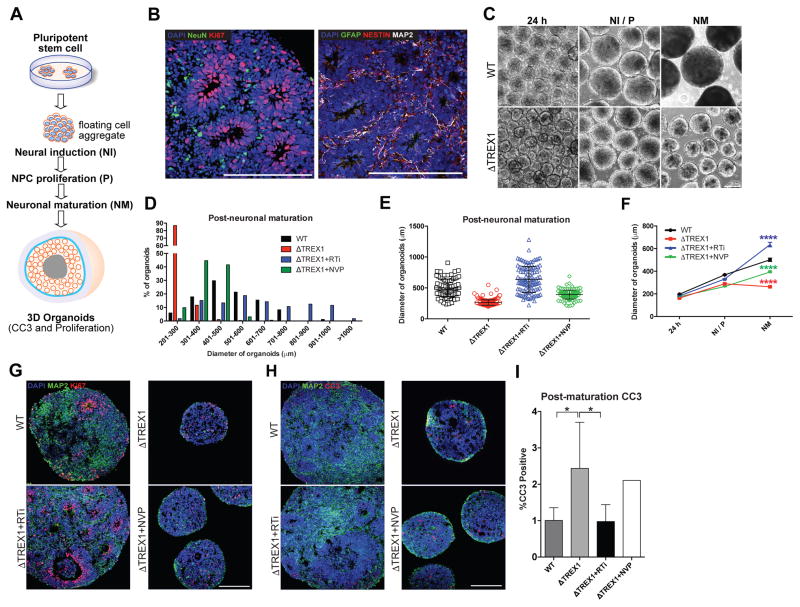
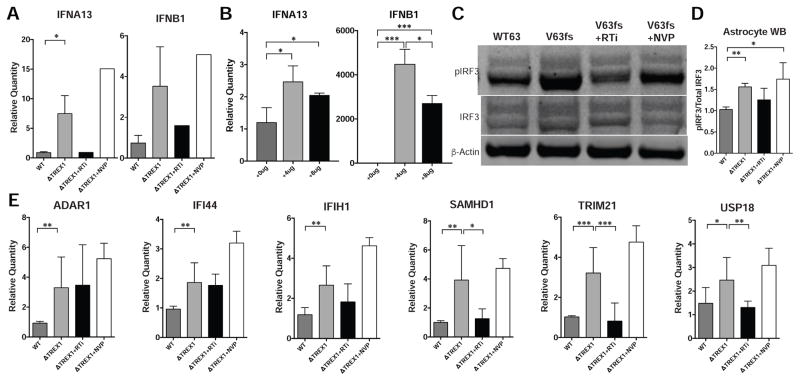
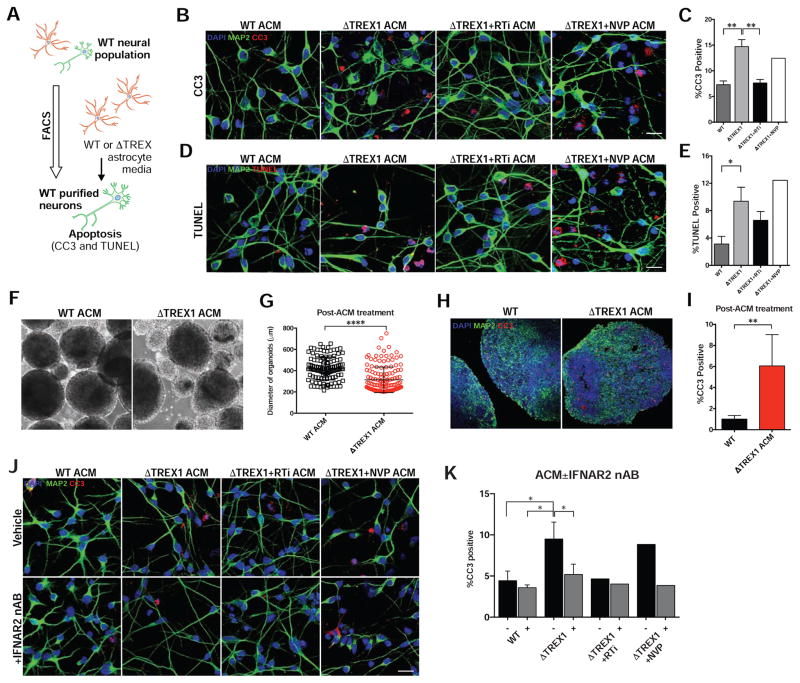
Three-prime repair exonuclease 1 (TREX1) is an anti-viral enzyme that cleaves nucleic acids in the cytosol, preventing accumulation and a subsequent type I interferon-associated inflammatory response. Autoimmune diseases, including Aicardi-Goutières syndrome (AGS) and systemic lupus erythematosus, can arise when TREX1 function is compromised. AGS is a neuroinflammatory disorder with severe and persistent intellectual and physical problems. Here we generated a human AGS model that recapitulates disease-relevant phenotypes using pluripotent stem cells lacking TREX1. We observed abundant extrachromosomal DNA in TREX1-deficient neural cells, of which endogenous Long Interspersed Element-1 retrotransposons were a major source. TREX1-deficient neurons also exhibited increased apoptosis and formed three-dimensional cortical organoids of reduced size. TREX1-deficient astrocytes further contributed to the observed neurotoxicity through increased type I interferon secretion. In this model, reverse-transcriptase inhibitors rescued the neurotoxicity of AGS neurons and organoids, highlighting their potential utility in therapeutic regimens for AGS and related disorders.

Keywords: Aicardi-Goutières syndrome; LINE-1; TREX1; disease modeling; neuroinflammation; type I IFN.


Figures

Figure 1
Figure 1. TREX-1-deficient neural cells exhibit higher levels of ssDNA in the cytosol (see also Figures S1–S3)
A, Schematic representation of the TREX1 gene showing the mutations in the derived pluripotent lines. B, DNA sequence chromatogram displaying the nucleotide changes in the TREX1 sequence in the mutant lines. A golden box denotes a nucleotide mutation. The amino acid sequence is provided in the white ribbon beneath the nucleic acid sequence. C, Schematic representation of the generation of cell lines and differentiation into neural cells. D, Phase-contrast images showing differentiation in the neural lineage. Scale bar, 200μm. E, Representative fluorescence images showing differentiation in the neural lineage. Scale bar, 20μm. F, Representative images of ssDNA immunofluorescence in NPCs, neurons and astrocytes. Scale bar, 20μm. G, Quantification of ssDNA puncta in the cytosol of NPCs, neurons and astrocytes. All ssDNA images were blindly acquired and ssDNA puncta were blindly quantified. The numbers of puncta per cell for each line were averaged and graphed according to genotype (n = 3 cell lines). Each mutant line was chronically treated with nucleoside analogue reverse-transcriptase inhibitors 3TC and d4T (RTi), then subjected to imaging, and the results were graphed (n = 3 cell lines). The V63fs line was also chronically treated with the non-nucleoside analogue reverse-transcriptase inhibitor NVP (n = 1 cell line). The presented values are the means ± SD. Student’s t-tests with Welch’s correction were performed to compare genotypes. *P<0.05; **P<0.01. H, Normalized TREX1 expression across differentiation using RNA sequencing data from control cell lines (n = 3 cell lines). The presented values are the means ± SEM. I, Fluorescence images showing subcellular localization of TREX1 in control NPCs. Scale bar, 20μm. J, Western blot on astrocyte protein lysates measuring levels of TREX1.
Figure 2
Figure 2. TREX-1-deficient NPCs exhibit higher levels of L1 ssDNA in the extrachromosomal fraction (see also Figure S4)
A, Schematic protocol to extract extrachromosomal ssDNA for deep sequencing and qPCR. B, Relative quantity of LINE species in the extrachromosomal fraction, as determined by deep sequencing. C, Relative quantity of the youngest subfamily L1Hs in the extrachromosomal fraction, as determined by deep sequencing. D, L1 copies in the extrachromosomal fraction were quantified with three different primers corresponding to different regions of L1 and then graphed. L1 copies were acquired in duplicate and normalized to the cell number at the time of extrachromosomal DNA extraction. The L1 copy numbers in each line were averaged and graphed according to genotype (n = 6; 3 cell lines, 2 individual Hirt extractions each). Each mutant line was chronically treated with RTi (3TC and d4T), and then subjected to quantification in duplicate, and the results were graphed (n = 6; 3 cell lines, 2 individual Hirt extractions each). The V63fs line was chronically treated with NVP, then subjected to quantification, and the results graphed (n = 2; 1 cell line, 2 individual Hirt extractions). The presented values are the means ± SD. Student’s t-tests with Welch’s correction were performed to compare genotypes. E, Fluorescence images showing L1 ORF1p and L1 ORF2p in the cytosol of TREX1-deficient NPCs. Scale bar, 20μm. F, Representative images of ssDNA immunofluorescence in TREX1-deficient NPCs with or without shLINE1 transfection. Scale bar, 20μm. G, Quantification of ssDNA puncta in TREX1-deficient NPCs with or without shLINE1. The presented values are the means ± SEM (V63fs, n = 75 cells) (shLINE1, n = 25 cells). H, Schematic of retrotransposition assay. NPCs are transfected with p99-GFP-LRE3-mCherry construct and analyzed by FACS 9 days post-transfection. I, Schematic map of p99-GFP-LRE-mCherry construct. J, Quantification of NPCs with de novo retrotransposition events (eGFP-positive cells) normalized by live cell number and transfection efficiency (n = 3; n = separate transfections). *P<0.05; **P<0.01.
Figure 3
Figure 3. TREX1 deficiency promotes neurotoxicity (see also Figure S5)
A, Schematic protocol of neuronal purification by FACS. B, Expression of neuronal markers determined by qPCR. The presented values are the means ± SD (n = 3 cell lines). Expression was normalized to zero, and B2M and HPRT1 were used as dual internal references. C–F, Representative images of CC3 and TUNEL staining, along with the corresponding graphs. CC3 and TUNEL images of purified neurons were acquired, and the percentages of apoptotic cells were calculated, averaged, and graphed according to genotype (n = 3 cell lines). Each mutant line was chronically treated with RTi (3TC and d4T), and then subjected to imaging, and the results were graphed (n = 3 cell lines). The V63fs line was chronically treated with NVP, and then subjected to imaging, and the results were graphed. White arrowheads point out CC3 or TUNEL-positive cells. Scale bar, 20μm. The presented values are the means ± SD. G, Representative images of CC3 immunofluorescence in 2 week-old TREX1-deficient neurons with or without shLINE1 transduction. Scale bar, 20μm. H, Quantification of percentages of CC3-positive TREX1-deficient neurons with or without shLINE1. The presented values are the means ± SEM. Student’s t-tests were performed to compare genotypes. *P<0.05; **P<0.01.
Figure 4
Figure 4. TREX1-deficient cortical organoids demonstrate a microcephaly-like reductionin size (see also Figure S5)
A, Schematic protocol of cortical organoid generation. B, Images of immunostaining showing presence of neural cells within control 3D organoids. Scale bar, 200μm. C, Representative images of organoids used to measure diameter over stages of maturation. Scale bar, 200μm. D, Histogram showing distribution of organoids for each genotype/treatment after neuronal maturation. E, Scatter plot showing quantification of organoid diameter (WT, n = 84 organoids) (ΔTREX1, n = 282 organoids) (RTi, n = 112 organoids) (NVP, n = 161 organoids). The error bars shown represent SEM. F, Line graph quantifying organoid diameter 24 hours after formation (24 h), after neural induction/proliferation (NI/P, day 15), and after neuronal maturation (NM, day 35). The error bars shown represent SEM. G, Representative immunofluorescence images of organoids used to examine proliferation using Ki67. H–I, Representative images of CC3 staining of organoid, along with the corresponding graph. CC3 images of organoids were acquired, and the percentages of apoptotic cells were calculated, averaged, and graphed according to genotype (n = 5 organoids). The V63fs mutant organoids were chronically treated with RTi, and then subjected to imaging, and the results were graphed (n = 5 organoids). The V63fs organoids were chronically treated with NVP, and then subjected to imaging, and the results were graphed (n = 5 organoids). The presented values are the means ± SD. Student’s t-tests with Welch’s correction were performed to compare genotypes. *P<0.05; **P<0.01; ***P<0.001; ****P<0.0001.
Figure 5
Figure 5. TREX1-deficient astrocytes upregulate interferon and interferon-stimulated genes (see also Figure S6)
A, Expression of IFNα13 and IFNβ1 determined by qPCR (n = 3 cell lines, RTi, n = 1 cell line, NVP, n = 1 cell line). B, Expression of IFNα13 and IFNβ1 determined by qPCR in WT astrocytes transfected with ssDNA (n = 3 replicates). C, Western blot on astrocyte protein lysates measuring levels of phosphorylated IRF3, IRF3, and β-Actin. D, Quantification of phosphorylated IRF3/total IRF3 from western blot using protein lysates from isogenic cell lines and their treatments, normalized to V63fs (n = 4; 2 cell lines, with 2 technical replicates; RTi, n = 3, 2 cell lines with technical replicate; NVP, n = 3; 2 cell lines with technical replicate). E, Expression of ISGs determined by qPCR. The presented values are the means ± standard deviation (n = 3 cell lines; RTi, n = 3 cell lines; NVP, n = 1 cell lines). Student’s t-tests were performed to compare genotypes. Expression was normalized to zero, and B2M and HPRT1 were used as dual internal references. *P<0.05; **P<0.01; ***P<0.001.
Figure 6
Figure 6. TREX1 deficiency in astrocytes exacerbates neurotoxicity through type-I interferons (see also Figure S6)
A, Schematic protocol of astrocyte-conditioned media experiments (ACM) on H9 purified neurons. B–E, Representative images of CC3 and TUNEL images of H9 purified neurons overlaid with ACM of different genotypes, along with corresponding graphs (n = 3 cell lines). Each mutant line was chronically treated with RTi (3TC and d4T), and RTi was removed during media conditioning (n = 3 cell lines). The V63fs line was chronically treated with NVP, and NVP was removed during media conditioning (n = 1 cell lines). Scale bar, 20μm. The presented values are the means ± standard deviation. F, Representative images of control organoids treated with conditioned media from control or V63fs mutant astrocytes. G, Scatter plot showing quantification of organoid diameter after 14 days of treatment with ACM. Each point represents one organoid (WT, n = 121 organoids, ΔTREX1, n = 145 organoids). The error bars shown represent SEM. Scale bar, 200μm. H–I, Representative images of CC3 staining of organoid after treatment with V63fs mutant ACM for 14 days, along with the corresponding graph. CC3 images of organoids were acquired, and the percentages of apoptotic cells were calculated, averaged, and graphed (WT, n = 5 organoids, ΔTREX1, n = 6 organoids). Total of 35 days of organoid differentiation. The presented values are the means ± SD. Student’s t-tests were performed to compare treatments. Scale bar, 200μm. J–K, Representative images of CC3 and images of H9 purified neurons overlaid with ACM of different genotypes with or without the addition of IFNAR2 neutralizing antibody, along with corresponding graphs (n = 3 cell lines, RTi, n = 1 cell line, NVP, n = 1 cell line). The V63fs mutant line was chronically treated with RTi (3TC and d4T), and RTi was removed during media conditioning (n = 1 cell line). The V63fs line was chronically treated with NVP, and NVP was removed during media conditioning (n = 1 cell line). Scale bar, 20μm. The presented values are the means ± SD. Student’s t-tests with Welch’s correction were performed to compare genotypes. *P<0.05; **P<0.01; ***P<0.001; ****P<0.0001.

Comment in

Similar articles

Cited by

References

    1. Akwa Y, Hassett DE, Eloranta ML, Sandberg K, Masliah E, Powell H, Whitton JL, Bloom FE, Campbell IL. Transgenic expression of IFN-alpha in the central nervous system of mice protects against lethal neurotropic viral infection but induces inflammation and neurodegeneration. J Immunol. 1998;161:5016–5026. - PubMed
    1. Anders S, Pyl PT, Huber W. HTSeq-a Python framework to work with high-throughput sequencing data. Bioinformatics. 2015;31:166–169. - PMC - PubMed
    1. Arad U. Modified Hirt procedure for rapid purification of extrachromosomal DNA from mammalian cells. Biotechniques. 1998;24:760–762. - PubMed
    1. Bloom GS. Amyloid-beta and tau: the trigger and bullet in Alzheimer disease pathogenesis. JAMA Neurol. 2014;71:505–508. - PubMed
    1. Brouha B, Meischl C, Ostertag E, de Boer M, Zhang Y, Neijens H, Roos D, Kazazian HH., Jr Evidence consistent with human L1 retrotransposition in maternal meiosis I. Am J Hum Genet. 2002;71:327–336. - PMC - PubMed

Publication types

MeSH terms