. 2017 Nov;63(4):e12440.
doi: 10.1111/jpi.12440. Epub 2017 Sep 6.

Melatonin ameliorates hypoglycemic stress-induced brain endothelial tight junction injury by inhibiting protein nitration of TP53-induced glycolysis and apoptosis regulator

Affiliations

Melatonin ameliorates hypoglycemic stress-induced brain endothelial tight junction injury by inhibiting protein nitration of TP53-induced glycolysis and apoptosis regulator

Cheng-Kun Wang et al. J Pineal Res. 2017 Nov.

Abstract

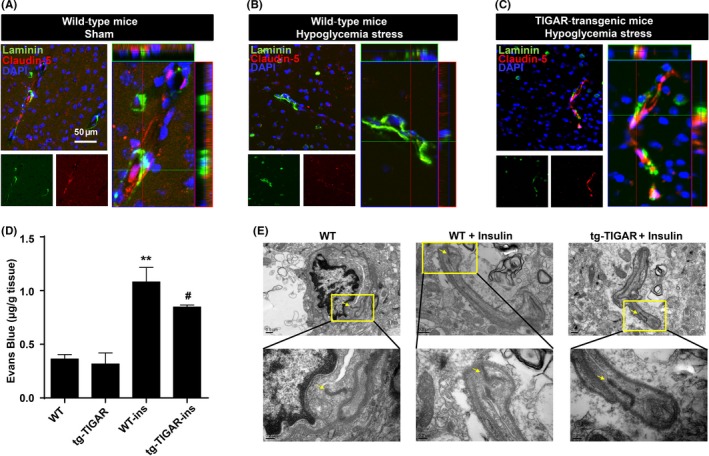
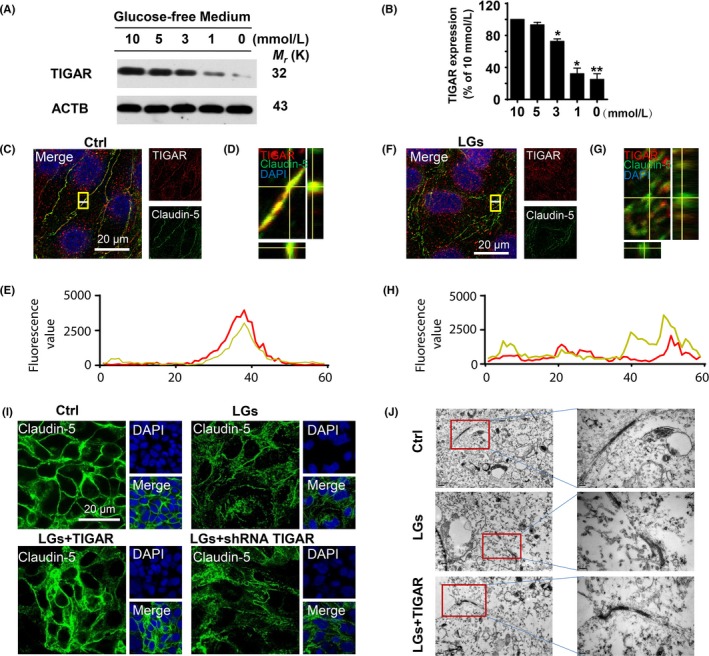
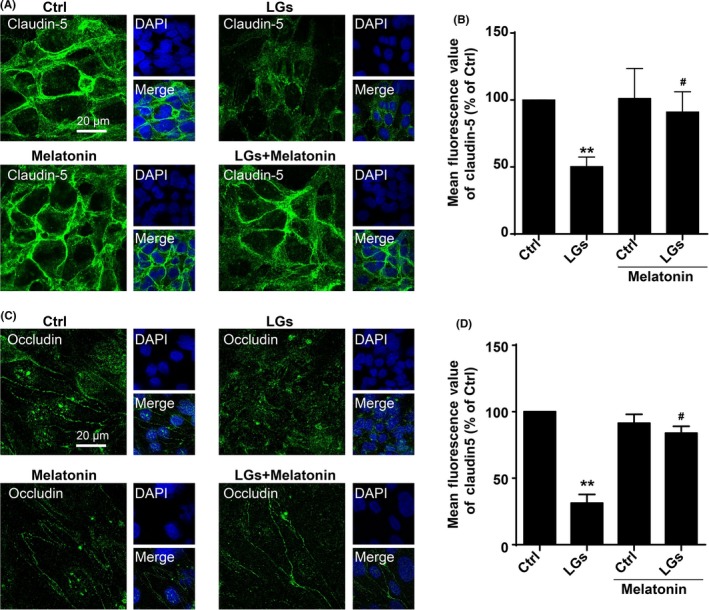
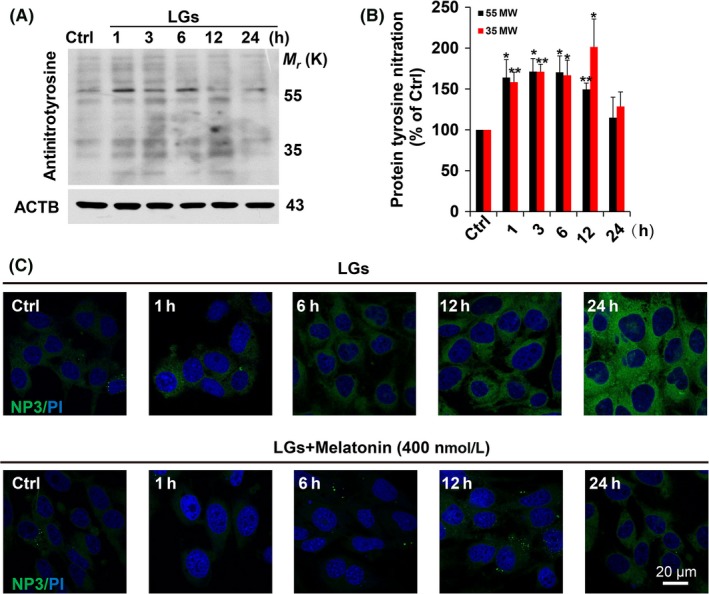
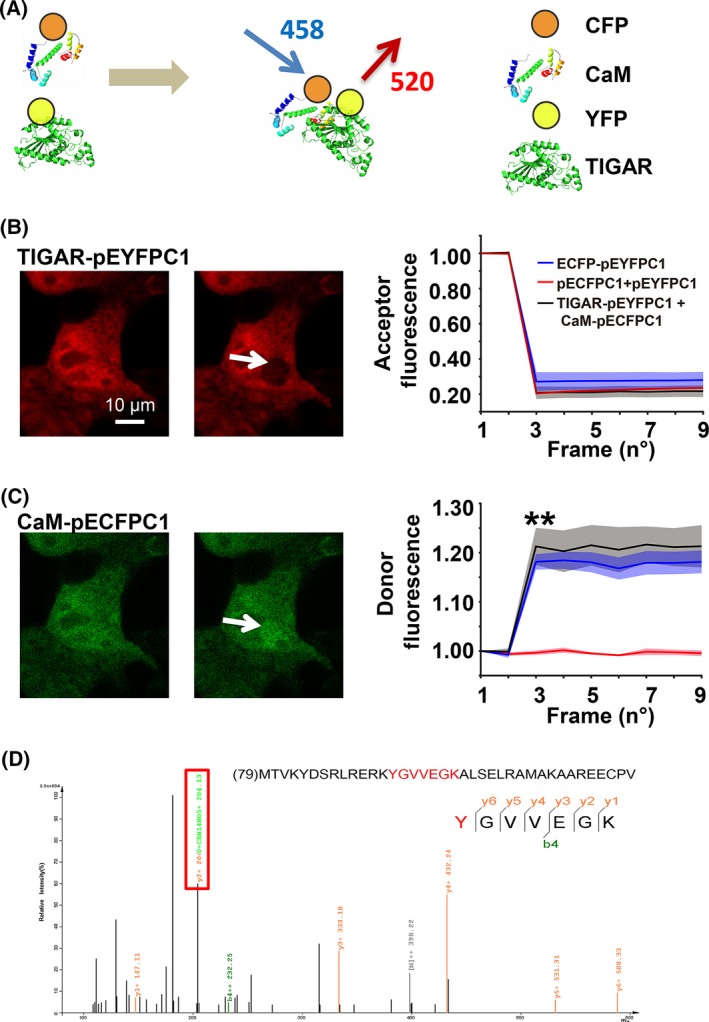
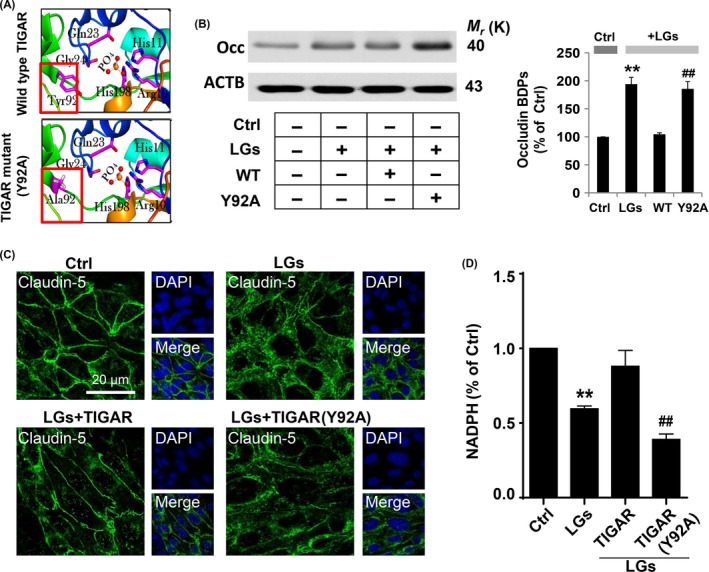
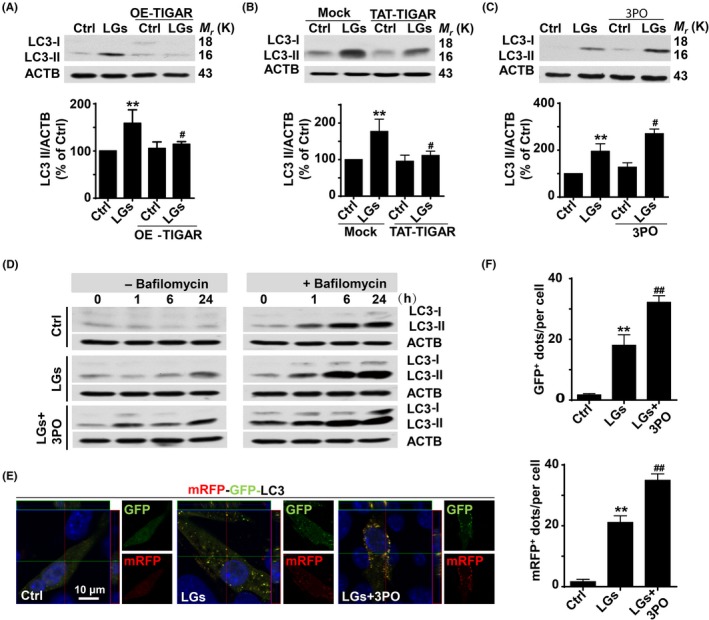
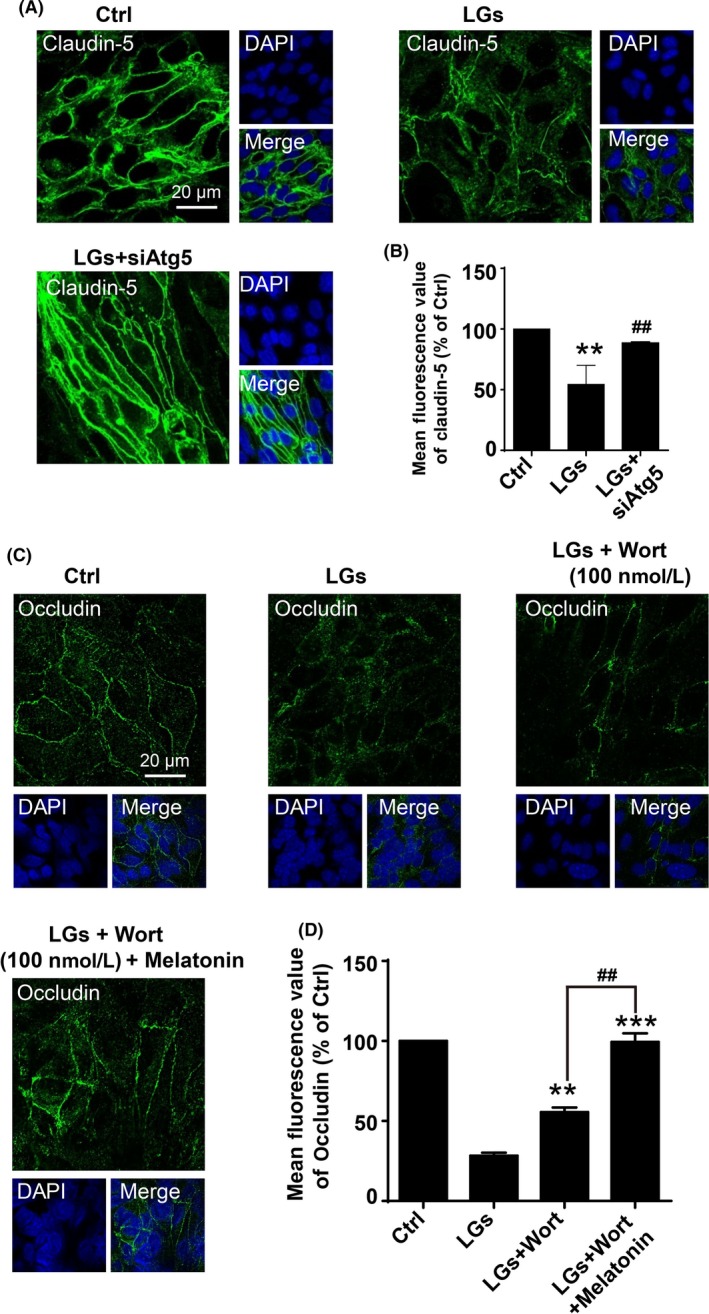
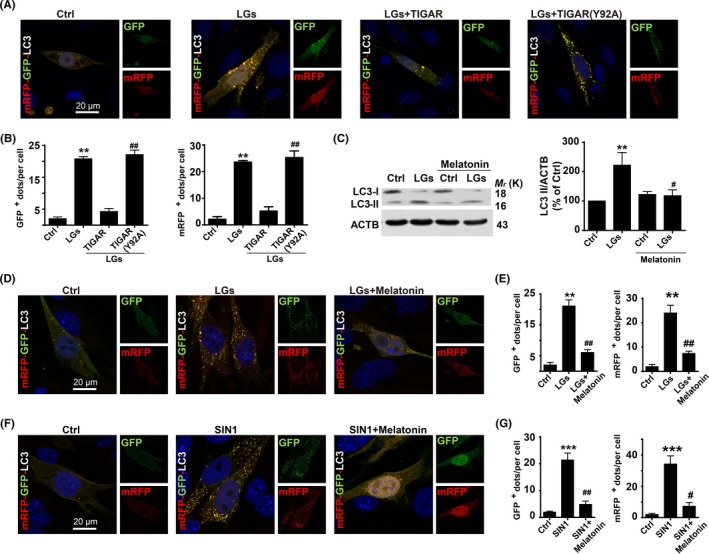
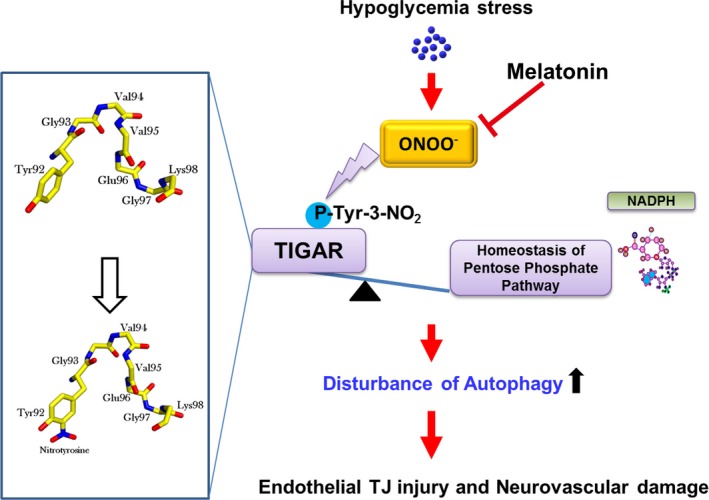
Severe hypoglycemia has a detrimental impact on the cerebrovasculature, but the molecular events that lead to the disruption of the integrity of the tight junctions remain unclear. Here, we report that the microvessel integrity was dramatically compromised (59.41% of wild-type mice) in TP53-induced glycolysis and apoptosis regulator (TIGAR) transgenic mice stressed by hypoglycemia. Melatonin, a potent antioxidant, protects against hypoglycemic stress-induced brain endothelial tight junction injury in the dosage of 400 nmol/L in vitro. FRET (fluorescence resonance energy transfer) imaging data of endothelial cells stressed by low glucose revealed that TIGAR couples with calmodulin to promote TIGAR tyrosine nitration. A tyrosine 92 mutation interferes with the TIGAR-dependent NADPH generation (55.60% decreased) and abolishes its protective effect on tight junctions in human brain microvascular endothelial cells. We further demonstrate that the low-glucose-induced disruption of occludin and Caludin5 as well as activation of autophagy was abrogated by melatonin-mediated blockade of nitrosative stress in vitro. Collectively, we provide information on the detailed molecular mechanisms for the protective actions of melatonin on brain endothelial tight junctions and suggest that this indole has translational potential for severe hypoglycemia-induced neurovascular damage.

Keywords: TP53-induced glycolysis and apoptosis regulator; autophagy; hypoglycemic stress; melatonin; neurovascular; tight junctions.


Figures

Figure 1
Figure 1
Vasoprotective role of TP53‐induced glycolysis and apoptosis regulator (TIGAR) during hypoglycemia stress in mice. (A‐C) Double immunohistochemical staining for laminin and claudin‐5 in the brain cortex after insulin‐induced hypoglycemia in wild‐type and tg‐TIGAR mice. Fluorescence staining for laminin (green) and claudin‐5 (red) was performed in the brain cortex 12 h after hypoglycemia‐induced brain injury in mice. Representative Z‐stack images were presented to confirm the co‐localization of laminin and claudin‐5 throughout the microvessels. Each image shown is representative of 5 independent mice. Scale bar: 50 μm. (D) Effect of TIGAR on BBB integrity upon hypoglycemic injury. Evans blue (μg/g brain tissue) levels in the brain cortex were examined by spectrophotometry in both WT and tg‐TIGAR mice 12 h after hypoglycemia‐induced brain injury. The data are expressed as the mean ± SEM.; n = 5 mice/group. **P < .01 vs wild‐type mice; # < .05 vs wild‐type mice under hypoglycemic stress. (E) Ultrastructural changes in endothelial tight junctions in the brain cortex after hypoglycemic injury. Tight junction structures flanked by arrowheads in the images are shown at a larger magnification in lower panel. Hypoglycemia was induced by a single injection of insulin (2 units/kg body weight) in wild‐type and tg‐TIGAR mice. The mice were perfused with 4% paraformaldehyde and 0.25% glutaraldehyde and then processed for electron microscopic examination. The photomicrographs represent samples taken from 3 mice in each group
Figure 2
Figure 2
TP53‐induced glycolysis and apoptosis regulator (TIGAR) is dysregulated during low‐glucose stimulation. (A) Changes in TIGAR protein levels in cell lysates of human brain microvascular endothelial cells in glucose‐free medium conditions. (B) Quantitative analysis of TIGAR protein levels in (A). Data are expressed as the mean ± SEM from 3 independent experiments. *< .05 and **< .01 vs percentage of 10 mmol/L glucose cultured group. (C‐E) Subcellular localization of TIGAR and claudin‐5 was determined by laser confocal microscopy. Immunostaining of endothelial TIGAR (red) and claudin‐5 (green) in control conditions. (D) Representative Z‐stack images shown in (C). (E) Florescence value of the white line in (C). (F‐H) Immunostaining of TIGAR (red) and claudin‐5 (green) after 24 h in the low‐glucose‐stressed conditions. (G) Representative Z‐stack images shown in (F). (H) Florescence value of the white line in (F). Scale bar, 20 μm. (I) Effect of TIGAR transfection on expression of claudin‐5 following low‐glucose stimulation. Inhibition of TIGAR by shRNA resulted in the disturbance of claudin‐5 expression (green), whereas overexpression of TIGAR preserved the tight junction proteins in HBMECs following 24‐h low‐glucose stimulation. (J) Representative electron micrograph images shows damage to tight junctions after 24‐h low‐glucose stress, whereas lentivirus‐TIGAR transfection preserved their integrity
Figure 3
Figure 3
Protective effect of melatonin on low‐glucose stress‐induced tight junction injury. (A) Representative images of claudin‐5 staining of brain endothelial cells in low‐glucose conditions with or without melatonin treatment. The cells were seeded on glass‐bottom 24‐well plates overnight and then followed by treatment with or without melatonin (400 nmol/L) in low‐glucose cultures for 24 hours. The nuclei were stained with DAPI (blue). Scale bar, 20 μm. (B) Melatonin treatment rescued tight junction injury in HBMECs, as assessed using the fluorescence intensity of tight junction marker claudin‐5. Florescence value is representative of 3 independent experiments expressed as mean ± SEM. **P < .01 vs percentage of control; # P < .05 vs percentage of low‐glucose‐treated group. (C) Confocal images stained for occludin in brain endothelial cells upon low‐glucose conditions. The cells were seeded on glass‐bottom 24‐well plates overnight and then followed by treatment with or without melatonin (400 nmol/L) in low‐glucose cultures for 24 h. The nuclei were stained with DAPI (blue). Scale bar, 20 μm. Quantification of the fluorescence intensity of occludin is presented on (D). Florescence value is representative of 3 independent experiments expressed as mean ± SEM. **P < .01 vs percentage of control; # P < .05 vs percentage of low‐glucose‐treated group
Figure 4
Figure 4
Melatonin treatment inhibits low‐glucose‐induced protein tyrosine nitration. (A) Intracellular 3‐nitrotyrosine (NT) was measured by Western blot analysis. The cultured HBMECs were subjected to low‐glucose stress (1 mmol/L) at the indicated times. Immunodetection of ACTB was used as a loading control. (B) Quantitative analysis of protein levels for (A) was performed by densitometry. The immunoblots are representative of 3 independent experiments and expressed as percentage of values of the control (mean ± SEM). *P < .05; **< .01 vs percentage of control. (C) Melatonin treatment reduced the formation of ONOO during low‐glucose stimulation. Characterization of ONOO formation by NP3 fluorescence probe in cultured HBMECs upon low‐glucose stimulation. The cells were seeded on glass‐bottom 24‐well plates overnight and then followed by treatment with or without melatonin (400 nmol/L) in low‐glucose cultures from 1 to 24 hours, then incubated with NP3 (5.0 μmol/L) for 15 min
Figure 5
Figure 5
Identification of a binding partner for TP53‐induced glycolysis and apoptosis regulator (TIGAR) during low‐glucose stress. (A) CFP‐labeled calmodulin (CaM‐pECFPC1) and YFP‐tagged TIGAR (TIGAR‐pEYFPC1) constructs were used for FRET analysis. (B) Acceptor fluorescence was recorded before and after photobleaching of the cell. There were no significant differences among the groups with respect to the acceptor fluorescence. (C) The percentage of donor fluorescence was recorded frame by frame before and after laser‐induced acceptor photobleaching. HEK293 cells were transfected with CaM‐pECFPC1/TIGAR‐pEYFPC1, and the emission signals of excited calmodulin‐pECFPC1 (FRET donor) were recorded. Data are expressed as the mean ± SEM values from 3 independent experiments. **< .01 vs control. (D) Identification of tyrosine 92 as TIGAR nitrated site. Tandem mass spectra of the nitrated peptide 92YGVVEGK98 from the TIGAR protein. The protein was digested with 20 ng/μL trypsin and then subjected to nano‐LC/MS/MS analysis. The modified peptide was manually verified. The sequence‐specific ions are labeled as y and b ions on the spectra. The peptide contained 3‐nitrotyrosine at the residue of Y92. Fragmentation of ions showed the diagnostic mass shift
Figure 6
Figure 6
Mutation of tyrosine 92 abolished the protective effect of TIGAR. (A) Ribbon diagrams for the active site in crystal structure (PDB entry: 3DCY) of TIGAR‐wild type and residues engaged in hydrogen bonds with the phosphate molecule in the Y92A mutant. (B) Mutation of tyrosine 92 abolished the protective effect of TIGAR on tight junctions. The brain endothelial cells were transfected with wild‐type TIGAR and mutant TIGAR (Y92A) following low‐glucose stress for 24 h. The protein lysates from brain endothelial cells were processed for Western blotting to detect occludin breakdown products (BDPs). Immunoblotting with ACTB antibody demonstrated equal protein loading in each lane. The histograms represent summaries of the mean currents after TIGAR (Y92A) transfection. The data are expressed as the densitometry ratio of the control (mean ± SEM) from 3 independent experiments. **< .01 vs control; ## < .01 vs WT transfection group. (C) Fluorescence immunocytochemical staining of claudin‐5 (green) showed hypoglycemia‐induced brain endothelial tight junction protein degradation. Mutation in the tyrosine 92 site in TIGAR protein abrogated its protective role compared to that of wild‐type TIGAR. DAPI counterstaining indicated nuclear localization (blue). Scale bar, 20 μm. (D) Plasmid‐mediated TIGAR overexpression increased NADPH levels in endothelial cells 24 h after low‐glucose stimulation, whereas mutant TIGAR (Y92A) have little effect. Data are expressed as the mean ± SEM values from 3 independent experiments. **< .01 vs control; ## < .01 vs WT transfection group
Figure 7
Figure 7
Inhibitory effect of TP53‐induced glycolysis and apoptosis regulator (TIGAR) on autophagy during low‐glucose stress. (A) TIGAR overexpression inhibited the autophagy activation in cells following low‐glucose stress. LC3‐II levels were markedly reduced, whereas immunoblotting with ACTB showed equal amounts of loaded protein. Data are expressed as the mean ± SEM from 3 independent experiments. **P < .01 vs percentage of control; # P < .05 vs percentage of low‐glucose‐treated group. (B) TAT‐TIGAR transfection against low‐glucose‐induced tight junction injury. Brain endothelial cells were transfected with recombinant human TAT‐TIGAR protein 24 h before low‐glucose mediated stress. ACTB served as a loading control. Data are expressed as the mean ± SEM from 3 independent experiments. **P < .01 vs percentage of control; # P < .05 vs percentage of low‐glucose‐treated group. (C) TIGAR inhibition amplifies the LC3‐II formation. Brain endothelial cells were subjected to low‐glucose stress for 24 h, and 3PO was added to the cell cultures. Representative Western blots showed that 3PO enhanced the LC3‐II accumulation. ACTB was used as the loading control. Data are expressed as the mean ± SEM from 3 independent experiments. **P < .01 vs percentage of control; # P < .05 vs percentage of low‐glucose‐treated group. (D) TIGAR inhibition exaggerates the LC3‐II accumulation. Brain endothelial cells were cultured for different time periods in low‐glucose conditions in the absence or presence of bafilomycin A1. Bafilomycin A1 treatment induced LC3‐II accumulation at 6 or 24 h following low‐glucose insult, which was further increased after 3PO treatment. (E) 3PO treatment exaggerated the formation of autophagosome and autolysosome in tandem fluorescent mRFP‐GFP‐LC3‐transfected HBMECs following 24‐h low‐glucose insult. The mRFP‐GFP‐LC3 puncta was amplified in endothelial cells incubated with 3PO vs punctate formation in cells under low‐glucose treatment alone. (F) Quantification of data from (E) was analyzed from the mean RFP‐LC3 and GFP‐LC3 dots per cell of 3 independent experiments. Data are expressed as mean ± SEM from 3 independent experiments in which at least 120 cells were analyzed. **< .01 vs control group; ## P < .01 vs low‐glucose‐treated cells
Figure 8
Figure 8
Inhibition of autophagy reduces tight junction injury during low‐glucose stress. (A) Representative immunofluorescence images of claudin‐5 staining of brain endothelial cells in the control and low‐glucose conditions. Cell cultures were transfected with siRNA‐Atg5, and Nuclei were stained with DAPI (blue). Scale bar, 20 μm. (B) Quantification of claudin‐5 expressions in (A). Data are expressed as the mean fluorescence intensity percentage ± SEM from 3 independent experiments. **P < .01 vs control; ## < .01 vs low‐glucose‐treated cells. (C) Synergistically inhibitory effect of wortmannin and melatonin on degradation of occludin in brain endothelial cells upon low‐glucose insult. The cells were treatment with wortmannin (100 nmol/L) alone or co‐incubation with wortmannin (100 nmol/L) and melatonin (400 nmol/L) in low‐glucose cultures for 24 h. The nuclei were stained with DAPI (blue). Scale bar, 20 μm. Quantification of the fluorescence intensity of occludin is presented on (D). Florescence value is representative of 3 independent experiments expressed as mean ± SEM. **P < .01; ***P < .001 vs percentage of low‐glucose‐treated cells; ## P < .01 vs percentage of low‐glucose‐treated group with wortmannin alone
Figure 9
Figure 9
Inhibitory effect of melatonin on autophagy during low‐glucose stress. (A) TP53‐induced glycolysis and apoptosis regulator (TIGAR) mutation abolishes its inhibitory effect on low‐glucose stress‐induced autophagy. Endothelial cells transfected with mRFP‐GFP‐LC3 were subjected to low glucose for 24 h, and nuclei were stained with DAPI. (B) Quantification of data from (A) was analyzed by mean GFP‐LC3 and mRFP‐LC3 dots per cell from 3 independent experiments in which at least 120 cells were analyzed. The data are expressed as the mean ± SEM. **P < .01 vs control; ## P < .01 vs WT transfection group. (C) Western blot analysis showing the effects of melatonin treatment on LC3‐II formation. Human brain endothelial cells were treated with melatonin (400 nmol/L) for 24 h following low‐glucose stimulation. The data are expressed as the mean ± SEM from 3 independent experiments. **P < .01; vs control; # P < .05 vs low‐glucose group. Scale bar, 20 μm. (D) Melatonin treatment reduced the low‐glucose‐induced mRFP‐GFP‐LC3 puncta formation. Immunocytochemical analysis of mRFP‐GFP fluorescent puncta in brain endothelial cells after low‐glucose stimulation for 24 h. (E) Quantification of data from (D) was analyzed from the mean mRFP‐LC3 and GFP‐LC3 puncta per cell of 3 independent experiments in which at least 110 cells were analyzed. The data are expressed as the mean ± SEM. **P < .01; vs control; ## P < .01 vs low‐glucose group. (F) Melatonin treatment reduced the nitrosative stress‐induced mRFP‐GFP‐LC3 puncta formation. Melatonin (400 nmol/L) treatment reduced the formation of autophagosome and autolysosome in tandem fluorescent mRFP‐GFP‐LC3‐transfected HBMECs. Immunocytochemical analysis of the formation of autophagosome and autolysosome in tandem fluorescent mRFP‐GFP‐LC3‐transfected HBMECs in the presence of SIN1. DAPI counterstaining indicates nuclear localization (blue). Scale bar, 10 μm. (G) Quantification of data from (F) was analyzed by mean GFP‐LC3 and RFP‐LC3 dots per cell from 3 independent experiments in which at least 110 cells were analyzed. The data are expressed as mean ± SEM. ***< .001 and ## P < .01 vs control group
Figure 10
Figure 10
Melatonin ameliorates hypoglycemic stress‐induced brain endothelial tight junction injury by inhibiting protein nitration of TP53‐induced glycolysis and apoptosis regulator (TIGAR). TJ = tight junction; ONOO = peroxynitrite anion

Similar articles

Cited by

References

    1. Gu YH, Kanazawa M, Hung SY, et al. Cathepsin L acutely alters microvessel integrity within the neurovascular unit during focal cerebral ischemia. J Cereb Blood Flow Metab. 2015;35:1888‐1900. - PMC - PubMed
    1. Quaegebeur A, Lange C, Carmeliet P. The neurovascular link in health and disease: molecular mechanisms and therapeutic implications. Neuron. 2011;71:406‐424. - PubMed
    1. Abbott NJ, Patabendige AA, Dolman DE, et al. Structure and function of the blood‐brain barrier. Neurobiol Dis. 2010;37:13‐25. - PubMed
    1. Cardoso FL, Brites D, Brito MA. Looking at the blood‐brain barrier: molecular anatomy and possible investigation approaches. Brain Res Rev. 2010;64:328‐363. - PubMed
    1. Cryer PE. Hypoglycemia, functional brain failure, and brain death. J Clin Invest. 2007;117:868‐870. - PMC - PubMed

MeSH terms