. 2017 Oct 1;28(20):2661-2675.
doi: 10.1091/mbc.E17-02-0087. Epub 2017 Aug 2.

Mechanical signals activate p38 MAPK pathway-dependent reinforcement of actin via mechanosensitive HspB1

Affiliations

Mechanical signals activate p38 MAPK pathway-dependent reinforcement of actin via mechanosensitive HspB1

Laura Hoffman et al. Mol Biol Cell. .

Abstract

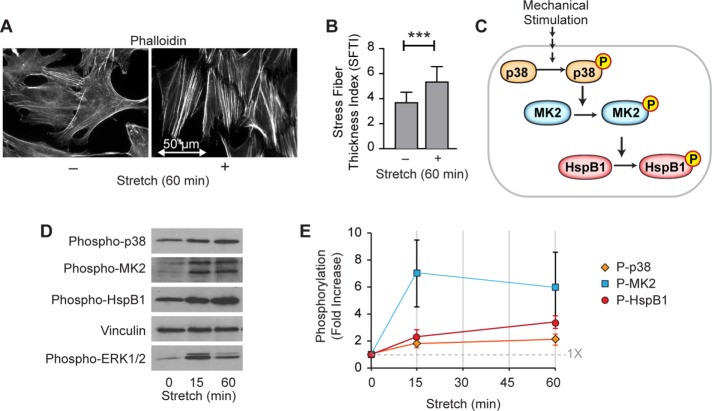
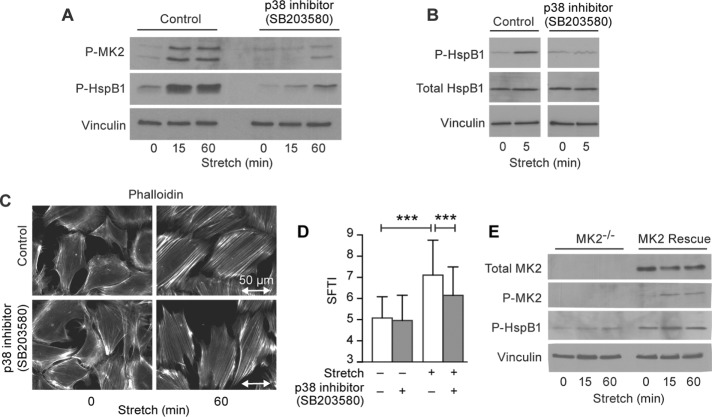
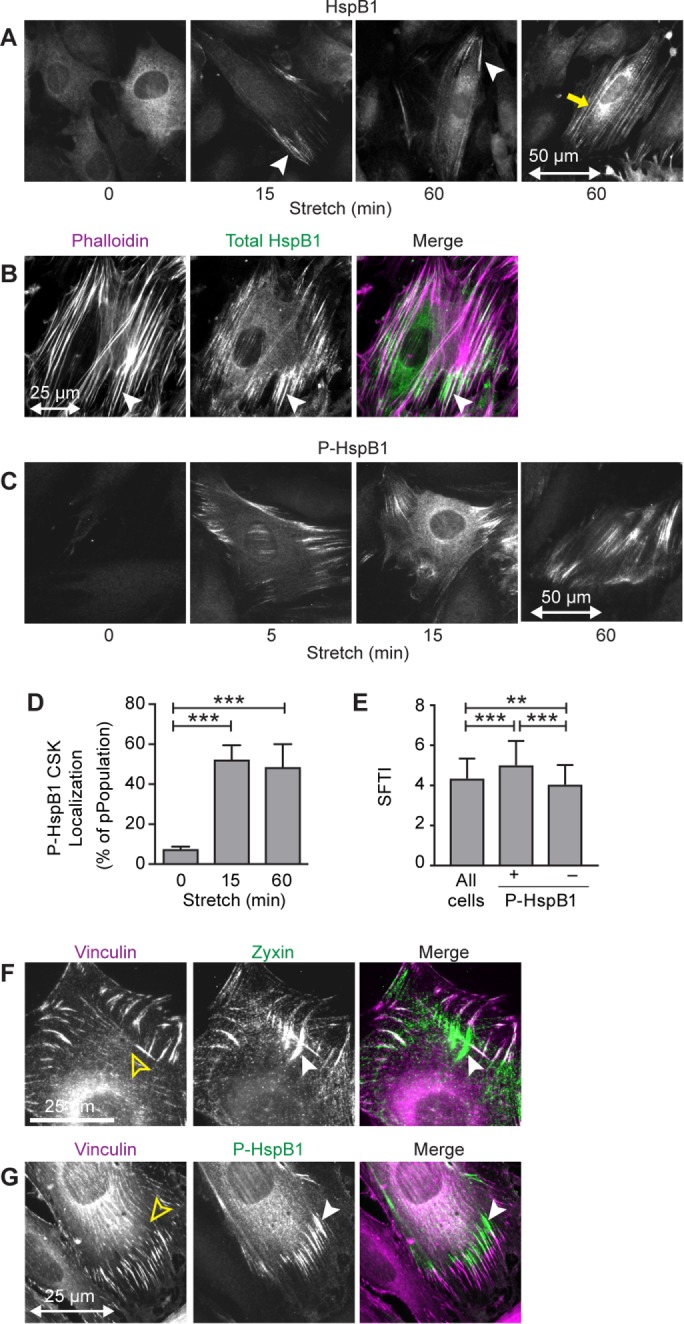
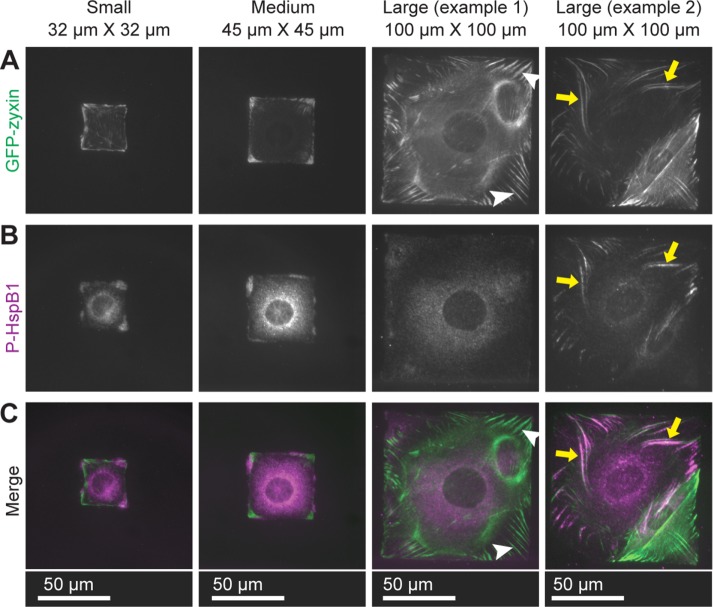
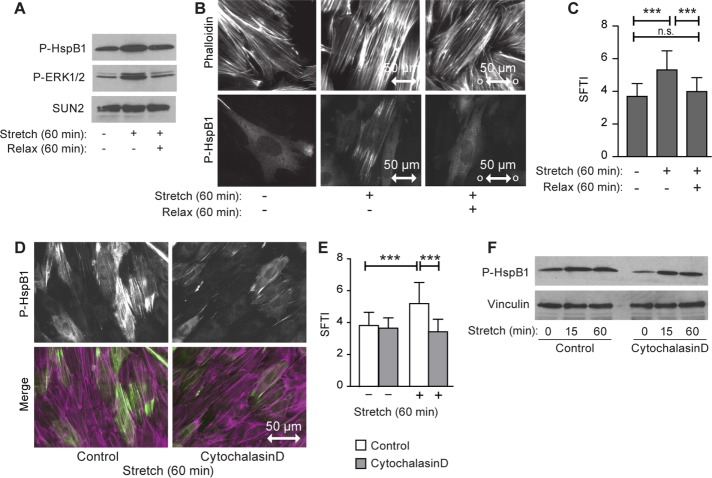
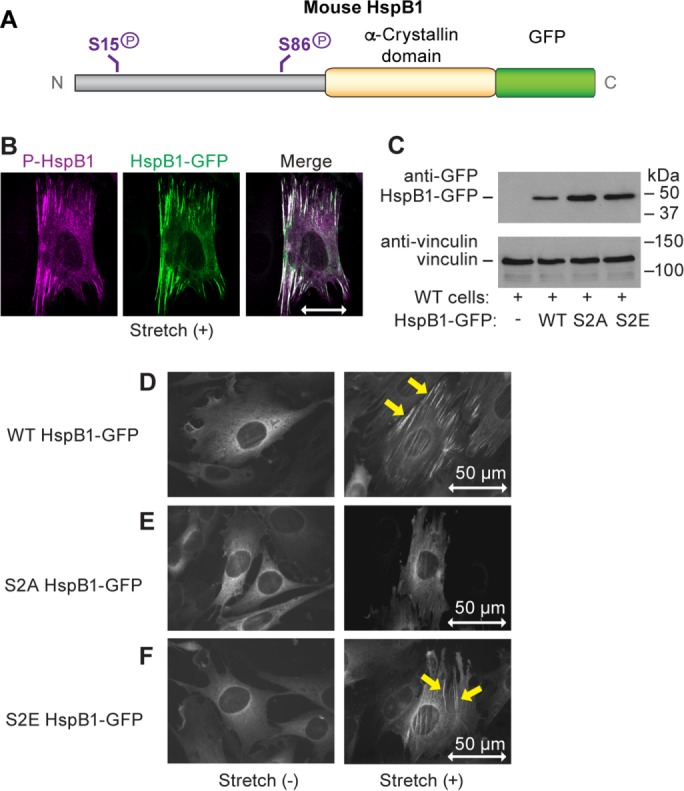
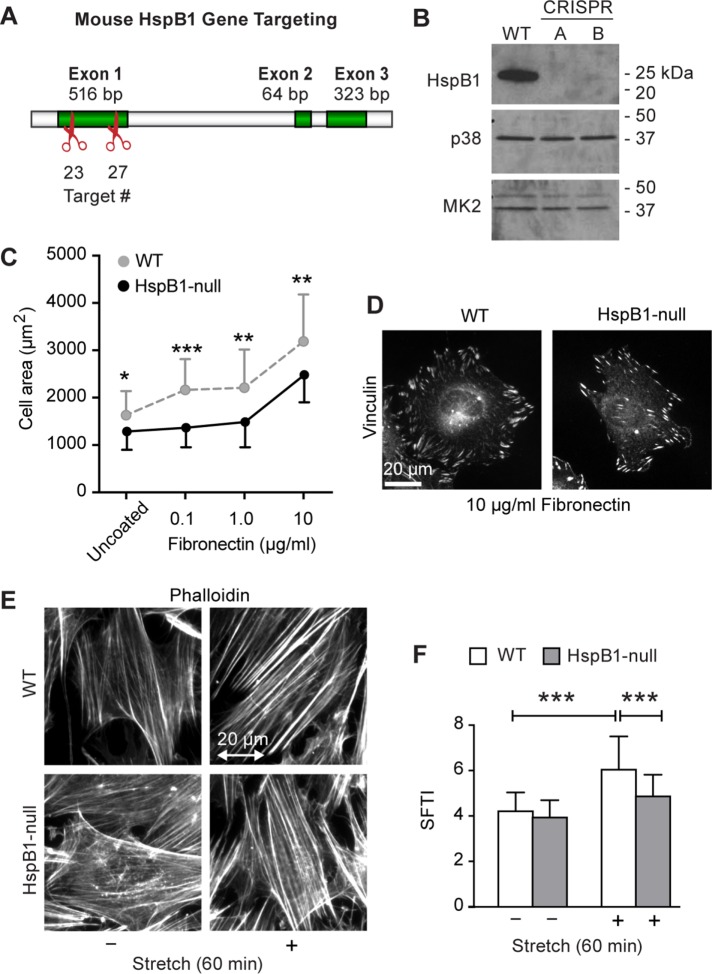
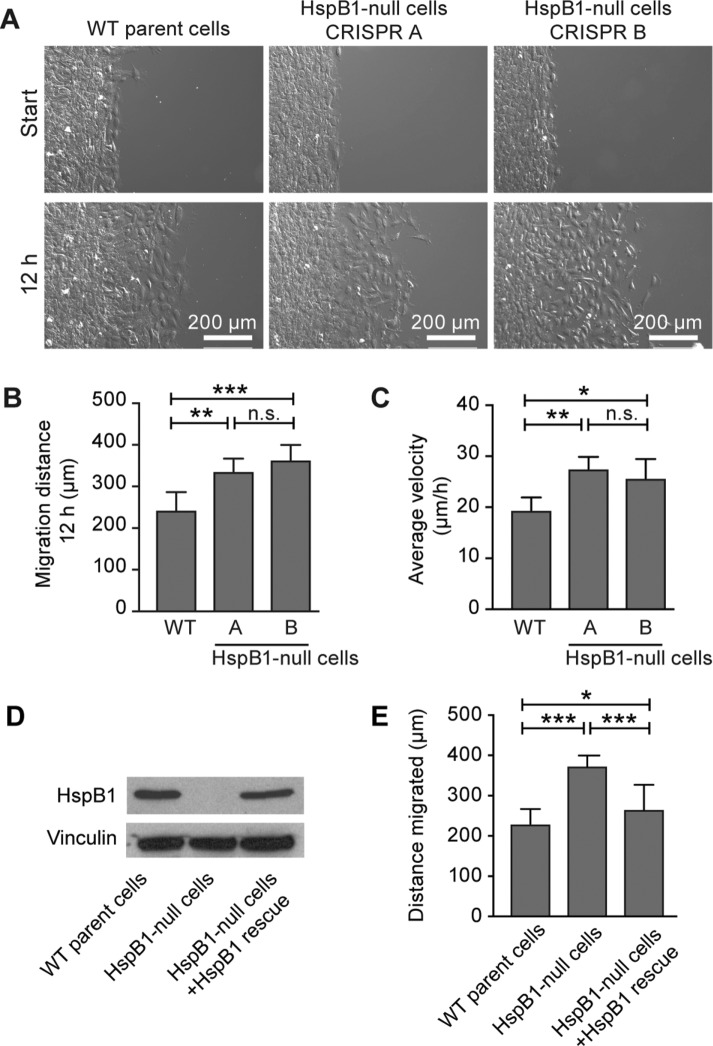
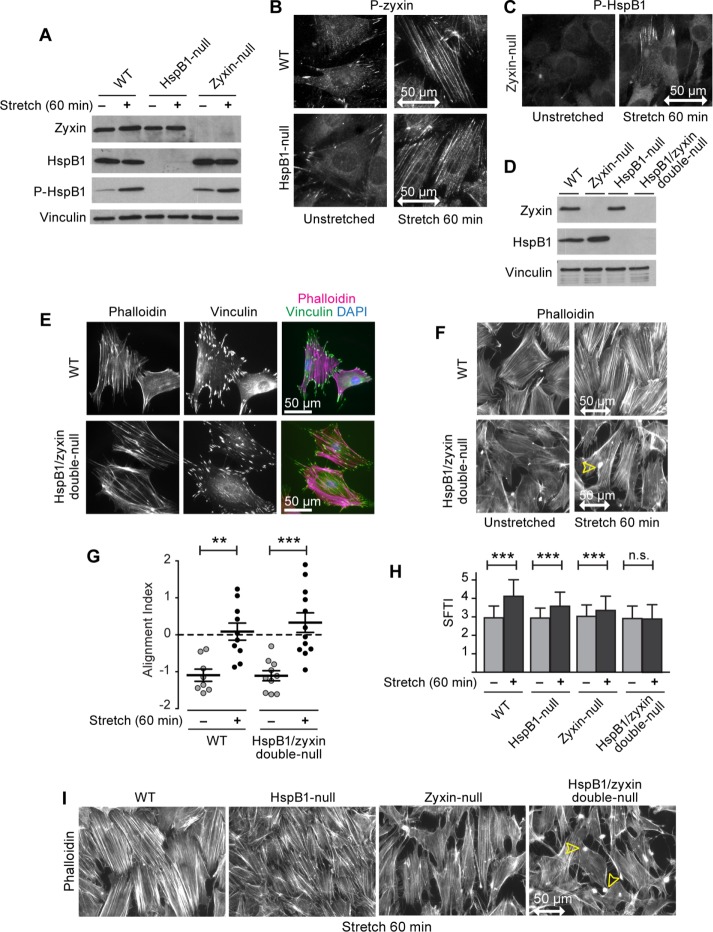
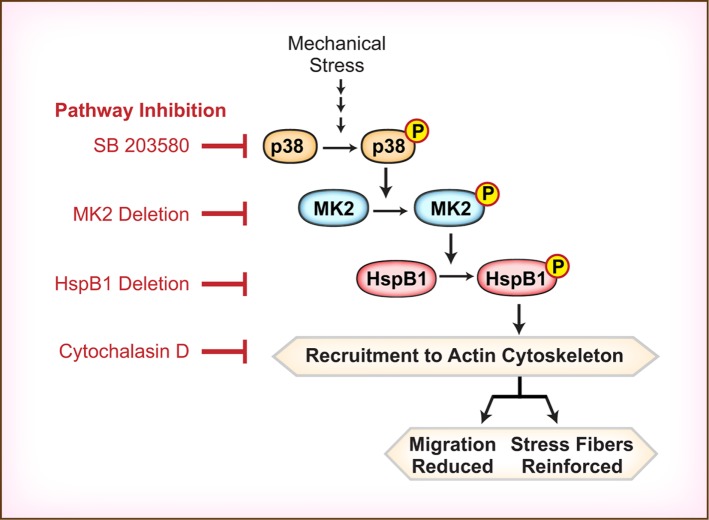
Despite the importance of a cell's ability to sense and respond to mechanical force, the molecular mechanisms by which physical cues are converted to cell-instructive chemical information to influence cell behaviors remain to be elucidated. Exposure of cultured fibroblasts to uniaxial cyclic stretch results in an actin stress fiber reinforcement response that stabilizes the actin cytoskeleton. p38 MAPK signaling is activated in response to stretch, and inhibition of p38 MAPK abrogates stretch-induced cytoskeletal reorganization. Here we show that the small heat shock protein HspB1 (hsp25/27) is phosphorylated in stretch-stimulated mouse fibroblasts via a p38 MAPK-dependent mechanism. Phosphorylated HspB1 is recruited to the actin cytoskeleton, displaying prominent accumulation on actin "comet tails" that emanate from focal adhesions in stretch-stimulated cells. Site-directed mutagenesis to block HspB1 phosphorylation inhibits the protein's cytoskeletal recruitment in response to mechanical stimulation. HspB1-null cells, generated by CRISPR/Cas9 nuclease genome editing, display an abrogated stretch-stimulated actin reinforcement response and increased cell migration. HspB1 is recruited to sites of increased traction force in cells geometrically constrained on micropatterned substrates. Our findings elucidate a molecular pathway by which a mechanical signal is transduced via activation of p38 MAPK to influence actin remodeling and cell migration via a zyxin-independent process.


Figures

FIGURE 1:
FIGURE 1:
Uniaxial cyclic stretch promotes actin remodeling and activation of p38 MAPK signaling. (A) Mouse fibroblasts were stimulated by uniaxial cyclic stretch (15%, 0.5 Hz, 1 h) followed by detection of F-actin with fluorescently tagged phalloidin; the stretch direction is on the horizontal plane, indicated by a double-headed arrow scaled to 50 μm. (B) Comparison of the SFTI of unstretched and stretch-stimulated cells revealed a statistically significant increase in SFTI. Graph is mean with SD, ***p < 0.0001 was calculated using unpaired Student’s t test that assumed Gaussian distribution and equal SD between populations, n >100 SFTI measurements in >13 microscopic fields per group. (C) Schematic representation of p38 MAPK pathway. (D) Western immunoblot analysis (20 μg protein per lane) revealed the activation of the p38 MAPK pathway in response to uniaxial cyclic stretch, as illustrated by phosphorylation of p38, MK2, and HspB1. Immunoblot detection of vinculin confirms equal protein loading across lanes and detection of ERK1/2 activation confirms effective delivery of the stretch signal. (E) Quantitation of phosphorylation signals relative to unstretched samples (set at onefold baseline) illustrates the sustained activation of p38 signaling during the 60 min period of the stretch regimen, mean with SD as pooled from more than three independent stretch experiments.
FIGURE 2:
FIGURE 2:
Inhibition of p38 MAPK signaling abrogates the stretch-induced actin SF reinforcement response. Mouse fibroblasts were preincubated with DMSO or p38 pathway inhibitor SB203580 (10 μM, 1 h) and were exposed to stretch stimulation (uniaxial cyclic stretch 15%, 0.5 Hz) followed by cell lysate preparation or fixation and staining. (A) Western immunoblot analysis of cell stretch response (15 min, 60 min) in the presence of p38 inhibitor SB203580. Control cells increase phospho-MK2 and phospho-HspB1 levels in response to stretch. Preincubation of cells with 10 μM SB203580 before and during stretch stimulation blocks the p38 activation of MK2 and HspB1. (B) Western immunoblot analysis to detect phosphorylated or total HspB1 in cell lysates (10 μg protein/lane) shows SB203580 inhibition of HspB1 phosphorylation within 5 min of stretch stimulation, while the total HspB1 levels are unaffected. Vinculin immunodetection confirms comparable protein loading. (C) Phalloidin-staining to visualize F-actin in unstretched and stretched cells under control or SB203580 treatment conditions. Double-headed arrow shows stretch direction and represents 50 μm scale. (D) SFTI analysis illustrates that inhibition of p38 MAPK abrogates the SF reinforcement response. Graph includes mean with SD (n = 161,160, 308, 372 roi, respectively). Statistical analysis was performed using an unpaired Student’s t test assuming Gaussian distribution and equal SD between populations; ***p value < 0.0001. (E) Western immunoblot of stretch-stimulated cell lysates (15 μg protein/lane) from MK2–/– cells and MK2–/– cells expressing a rescue MK2 protein. Total MK2 and phospho-MK2 immunoblots show lack of MK2 in MK2–/– cells and restoration of MK2 and stretch-stimulated phospho-MK2 in the rescue cells. Phospho-HspB1 is significantly increased in the MK2 rescue cells. Vinculin shows equivalent protein loading.
FIGURE 3:
FIGURE 3:
Phospho-HspB1 is recruited to discrete SF domains in response to uniaxial cyclic stretch. (A) Indirect immunofluorescence localization of total HspB1 in stretch-stimulated mouse fibroblasts shows diffuse cytoplasmic HspB1 distribution in unstretched cells and HspB1 recruitment to short linear elements within the cytoplasm of stretch-stimulated cells. Two examples of labeling are shown for the 60 min timepoint to illustrate that we observe HspB1 can be found at both SF termini (arrowheads) and full SFs (arrows) in stretched cells. (B) Double labelling of HspB1 and F-actin reveals that HspB1 displays a subcellular distribution that overlaps with actin SFs (arrowheads) but does not generally populate the entire expanse of transcellular SFs. (C) Indirect immunofluorescence localization of phosphorylated HspB1 shows a rapid accumulation of phospho-HspB1 in association with SF termini in stretched cells. Phospho-HspB1 is also detected on linear nuclear lines in some stretched cells. (D) Quantitation of the percentage of cells displaying discrete phospho-HspB1 localization under unstretched or stretched conditions compared across four independent experiments. (E) SFTI analysis of stretch-stimulated F-actin is presented as total population (4.3 SFTI, 251 roi) and then stratified for phospho-HspB1–positive cells (5.0 SFTI, 187 roi) and phospho-HspB1–negative cells (4.0 SFTI, 140 roi). Cells with phospho-HspB1 on the cytoskeleton generally have higher SFTI. (F) Double labeling of mouse fibroblast on coverslip with antibodies directed against vinculin (magenta) and zyxin (green). Scale bar is 25 μm. (G) Double labeling of stretch-stimulated fibroblast with antibodies directed against vinculin (magenta) and phospho-HspB1 (green). (F, G) The region of zyxin and phospho-HspB1 at comet tails (white arrowheads) that do not colocalize with vinculin (yellow arrowheads) is indicated. Double-headed arrows indicate the stretch vector and scale of 25 or 50 μm as designated. Graphs are shown as mean with SD. P values were determined by unpaired Student’s t test assuming Gaussian distribution and equal SD between populations. **p < 0.001, ***p < 0.0001, n.s. = not statistically significant.
FIGURE 4:
FIGURE 4:
Localization of phospho-HspB1 on micropatterned substrates reveals accumulation at sites of ruffling and elevated traction force. GFP-zyxin expressing cells were plated on fibronectin islands of various dimensions (small [1024 μm2], medium [2025 μm2], large [10,000 μm2]) and immunolabeled to detect phospho-HspB1. Both proteins are concentrated at the four corners of the square-shaped cells, with partially overlapping distributions. The large micropattern square induces the formation of prominent zyxin-rich comet tails (example 1) as was previously reported by Guo and Wang (2007). Phospho-HspB1 is colocalized with zyxin at some (large example 2, arrows) but not all (large example 1, arrowheads) of these structures. The scale bar of 50 μm is the same for all images.
FIGURE 5:
FIGURE 5:
Stretch-dependent phosphorylation and recruitment of HspB1 to the actin cytoskeleton. Cells were subjected to a “yoga” regimen of uniaxial cyclic stretch (15%, 0.5 Hz, 60 min) followed by relaxation (60 min). (A) Western immunoblot analysis (25 μg protein per lane) reveals that activation of HspB1 by phosphorylation is promoted by uniaxial cyclic stretch and that maintenance of stretch signaling is required to sustain HspB1 phosphorylation. Stretch control phospho-ERK1/2 signal is similarly stretch stimulated and then decreased by removal of stimuli. Loading control is nuclear envelope protein SUN2. (B) Comparison of unstretched, stretched, and stretched/relaxed cells reveals the stretch-induced accumulation of phospho-HspB1 on actin SFs (phalloidin), with diminished accumulation on cell relaxation. (C) SFTI analysis reveals that SF reinforcement increases with stretch stimulation and then declines to baseline levels when the stretch signal is removed (n = 259, 355, 289 roi, respectively). (D) Exposure to cytochalasin D (250 nM, preincubation 1 h, 7 μg protein) during stretch stimulation (15% uniaxial, 0.5 Hz, 15 min and 60 min) compromises the recruitment of phospho-HspB1 (green) to actin SFs (phalloidin, magenta) and abrogates the SF reinforcement response (E, SFTI analysis; n = 259, 149, 283, 147 roi, respectively). (F) Western immunoblot shows stretch-induced phosphorylation of HspB1 continues in the presence of cytochalasin D. Vinculin immunodetection confirms equal protein loading. Graphs are presented as mean with SD, p values were derived from unpaired t tests that assumed Gaussian distribution and equal SDs between populations, ***p < 0.0001, n.s. = not statistically significant.
FIGURE 6:
FIGURE 6:
Site-directed mutagenesis reveals the role of phosphorylation of HspB1 for its cytoskeletal recruitment. (A) Schematic representation of GFP-tagged murine HspB1 protein illustrating primary p38 MAPK pathway MK2-dependent phosphorylation sites at Serine15 and Serine86 and the alpha-crystallin domain. (B) Demonstration that C-terminally tagged HspB1-GFP (green) faithfully recapitulates the subcellular distribution of endogenous phospho-HspB1 (magenta) following stimulation of cells with uniaxial cyclic stretch. In the Merge image, the overlapping distribution of green and magenta is white. (C) Site-directed mutagenesis was deployed to convert serines 15 and 86 to either alanine (S2A) or glutamic acid (S2E). Western immunoblot analysis (20 μg cell lysate/lane) with antibody directed against GFP reveals expression of GFP-tagged WT or mutant variants of HspB1 in WT cells with vinculin detection as a loading control. Antibodies specific for GFP detect a single protein band with mobility at the expected range for the fusion protein, comigrating with the 50-kDa molecular weight marker. (D–F) Immunofluorescence microscopy of unstretched or stretched (15%, 0.5Hz, 1 h) cells harboring the (D) GFP-tagged WT HspB1 or the phosphorylation site variants, (E) S2A, or (F) S2E exhibit typical HspB1 recruitment to cytoskeleton (yellow arrows) for WT and S2E proteins. Mutation of serines 15 and 86 to alanine abrogates the recruitment of HspB1 to the actin cytoskeleton in response to uniaxial cyclic stretch. Double-headed arrow of 50 μm scale indicates stretch direction in the horizontal plane.
FIGURE 7:
FIGURE 7:
Generation of HspB1-null cells by CRISPR/Cas9 genome editing. (A) Schematic representation showing the genome editing scheme. The HspB1 gene has three exons; the two CRISPR/Cas9 nuclear targeting sites in Exon 1 are marked as target 23 and target 27. (B) Western immunoblot (10 μg protein per lane) with the parental WT cells shows loss of HspB1 expression in the two independently edited and isolated cell lines A and B. Elimination of HspB1 expression does not affect p38 or MK2 levels within cells. (C) Quantification of cell area for adhesion and spreading (3 h in media with 10% serum) on coverslips that were either uncoated or coated with 0.1 μg/ml, 1 μg/ml, or 10 μg/ml fibronectin to promote integrin engagement and focal adhesion formation (mean with SD; n>26 cells measured per condition). The HspB1-null cells lag behind the WT cells in spreading on fibronectin. (D) Vinculin immunolocalization in WT cells and HspB1-null cells on fibronectin-coated coverslips. (E) Use of fluorescent phalloidin to stain F-actin in WT or HspB1-null cells reveals that elimination of HspB1 expression does not result in actin deficits that are consistently evident by visual inspection. Actin filaments are present in both unstretched and stretched HspB1-null cells and SF alignment downstream of application of uniaxial cyclic stretch persists in the absence of HspB1 while the actin reinforcement is impaired. The stretch vector is represented by double-headed arrow of 20 μm scale. (F) Graph of SFTI analysis for Phalloidin-stained WT and HspB1-null cells in unstretched and stretched conditions (mean with SD; n > 300 roi per condition). Although not completely inhibited, elimination of HspB1 results in a statistically significant reduction in the SF reinforcement response to stretch stimulation, illustrating that HspB1 contributes in an appreciable way to the response of cells to mechanical stimulation. Graphs plotted as mean with SD; p values (*p < 0.05, **p < 0.001, ***p < 0.0001) were derived from unpaired t tests assuming Gaussian distribution and equal SDs between populations.
FIGURE 8:
FIGURE 8:
HspB1-null cells display enhanced cell migration. (A) Time-lapse microscopy was used to evaluate cell migration and compare the migratory behavior of cells from the parental WT line, as well as two independently derived HspB1-null lines, CRISPR A and CRISPR B. Cells were cultured to confluence within a confined area (Ibidi chambers) and then the barrier was removed, enabling directed cell migration from a well-defined edge. Migration of cells outward from the confluent cell island was monitored for 12 h. Fields of cells are shown at the beginning and at 12 h completion. Example time-lapse movies for WT, HspB1-null A, HspB1-null B cells are included as Supplemental Data. (B) Graph of 12 h migration distances for each cell type are shown from a single time-lapse experiment (9 measurements for each cell type) and the migration difference was reproduced in at least three independent experiments. WT cells migrated an average of 239 μm, HspB1-null A cells migrated an average of 332 μm, and HspB1-null B cells migrated an average of 360 μm over the 12 h period. (C) Graph of average velocity for each cell type showed a persistent migration difference in HspB1-null cells (four independent migration experiments). (D) Western immmunoblots (10 μg protein per lane) of WT parental cells, HspB1-null cells, and rescue HspB1 cells show the rescue HspB1 expression level approaches WT expression levels. Vinculin loading control confirms unchanged expression regardless of HspB1 status. (E) Quantitation of directed cell migration from a defined edge (Ibidi chambers) over a 12 h period. WT parental cells migrated an average of 230 μm (18 measurements), HspB1-null cells migrated an average of 372 μm (18 measurements), and HspB1 rescue cells migrated an average of 265 μm (18 measurements), suggesting that reexpression of HspB1 returned the cells to almost WT migration. Graphs are mean with SD; p values (*p < 0.05, **p < 0.001, ***p < 0.0001, n.s. = not significant) were determined using an unpaired t test that assumed Gaussian distribution and equal SDs between populations.
FIGURE 9:
FIGURE 9:
Parallel pathways of HspB1 and zyxin in the stretch-stimulated actin response. (A) Western immunoblot of cells lysates (10 μg/lane) of unstretched and stretched pairs (0, 60 min) from WT cells, HspB1-null cells, and zyxin-null cells. Zyxin (B72) signal is equivalent in the WT and HspB1-null cells but is absent from the zyxin-null cells, while the HspB1 signal is absent from the HspB1-null cells. Stretch-stimulated increase in phospho-HspB1 is maintained in the zyxin-null cells. Vinculin loading control confirms equal protein amounts in each lane. (B) Immunofluorescence staining of zyxin stretch response in WT cells shows zyxin focal adhesion distribution moves to stretch-stimulated actin. In HspB1-null cells, zyxin accumulation along stretch-stimulated actin SFs persists. (C) Immunofluorescence detection of phospho-HspB1 is low in unstretched zyxin-null cells and increases and localizes to the cytoskeleton in stretch-stimulated zyxin-null cells, as we previously described in WT cells (Figure 3). (D) Western immunoblot of WT, zyxin-null, HspB1-null, and HspB1/zyxin double-null cell lysates (10 μg protein/lane). Zyxin is detected in WT and HspB1-null cells. HspB1 is detected in WT and zyxin-null cells. Both zyxin and HspB1 are undetectable in the HspB1/zyxin double-null cells. Vinculin loading control shows comparable protein loading for all four cell types. (E) Immunofluorescence localization of F-actin (phalloidin, magenta) and vinculin (green) in WT cells and in HspB1/zyxin double-null cells. In unstimulated cells, the actin cytoskeleton and focal adhesions are maintained in HspB1/zyxin double-null cells. Scale bar is 50 μm. (F) Phalloidin staining of unstretched and stretch-stimulated WT cells reveals actin remodeling, reinforcement, and realignment perpendicular to stretch vector. In contrast, the HspB1/zyxin double-null cells fail to reinforce their actin filaments, and aggregates of actin (arrowhead) are detected. (G) Alignment analysis using distribution kurtosis on phalloidin-stained images indicated alignment perpendicular to the horizontal stretch vector increased with stretch stimulation of both cell types, and it was not different between WT and HspB1/zyxin double-null cells. The alignment index is graphed as mean with SEM, and p values were determined by unpaired t tests assuming Gaussian distributions with equal SD between populations. (H) SFTI analysis of unstretched (gray bars) and stretch-stimulated (black bars) cells (WT, HspB1-null, zyxin-null, HspB1/zyxin double-null). Unstretched/Stretched SFTI: WT cells 3.0/4.2, HspB1-null cells 3.0/3.6, zyxin-null 3.1/3.4, HspB1/zyxin double-null cells 3.0/3.0. Only HspB1/zyxin double-null cells were not significantly different (n.s.) by SFTI analysis. SFTI is graphed as mean with SD, greater than 100 measurements per condition, and unpaired t tests assumed Gaussian distributions with equal SD between populations. (I) Stretch-stimulated cells (uniaxial cyclic stretch, 15%, 0.5 Hz, 60 min) stained for F-actin (phalloidin) display alignment perpendicular to the stretch vector and variable stress fiber thickening (see H) depending on the presence or absence of HspB1, zyxin, or both proteins. Aggregates of F-actin in the HspB1/zyxin double-null cells are indicated by arrowheads. The stretch vector is represented by double-headed arrow of 50 μm scale. **p < 0.001, *** p < 0.0001, n.s. = not significantly different.
FIGURE 10:
FIGURE 10:
Model illustrating a proposed mechanism by which p38 MAPK signaling influences the response of cells to mechanical stress. Stretch activation of p38 results in phosphorylation and recruitment of HspB1 to the actin cytoskeleton, especially actin comet tails. Elimination of HspB1 function abrogates SF reinforcement and promotes cell migration. The HspB1 pathway provides a previously uncharacterized mechanism for mechanotransduction that is independent of the role of zyxin in stretch-induced actin remodeling.

Similar articles

Cited by

References

    1. Aikawa R, Nagai T, Kudoh S, Zou Y, Tanaka M, Tamura M, Akazawa H, Takano H, Nagai R, Komuro I. Integrins play a critical role in mechanical stress-induced p38 MAPK activation. Hypertension. 2002;39:233–238. - PubMed
    1. An SS, Fabry B, Mellema M, Bursac P, Gerthoffer WT, Kayyali US, Gaestel M, Shore SA, Fredberg JJ. Role of heat shock protein 27 in cytoskeletal remodeling of the airway smooth muscle cell. J Appl Physiol. 2004;96:1701–1713. - PubMed
    1. Ateshian GA, Humphrey JD. Continuum mixture models of biological growth and remodeling: past successes and future opportunities. Annu Rev Biomed Eng. 2012;14:97–111. - PubMed
    1. Beckerle MC. Identification of a new protein localized at sites of cell-substrate adhesion. J Cell Biol. 1986;103:1679–1687. - PMC - PubMed
    1. Benndorf R, Hayess K, Ryazantsev S, Wieske M, Behlke J, Lutsch G. Phosphorylation and supramolecular organization of murine small heat shock protein HSP25 abolish its actin polymerization-inhibiting activity. J Biol Chem. 1994;269:20780–20784. - PubMed

MeSH terms

LinkOut - more resources