Improved anticancer drug response prediction in cell lines using matrix factorization with similarity regularization
- PMID: 28768489
- PMCID: PMC5541434
- DOI: 10.1186/s12885-017-3500-5
Improved anticancer drug response prediction in cell lines using matrix factorization with similarity regularization
Abstract
Background: Human cancer cell lines are used in research to study the biology of cancer and to test cancer treatments. Recently there are already some large panels of several hundred human cancer cell lines which are characterized with genomic and pharmacological data. The ability to predict drug responses using these pharmacogenomics data can facilitate the development of precision cancer medicines. Although several methods have been developed to address the drug response prediction, there are many challenges in obtaining accurate prediction.
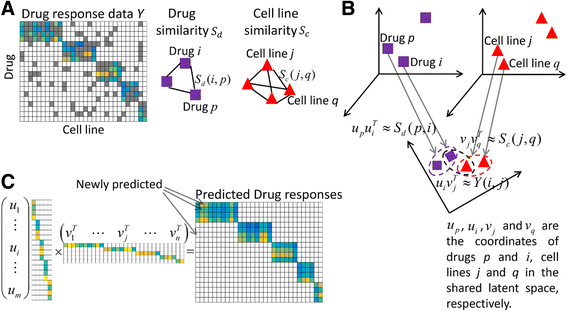
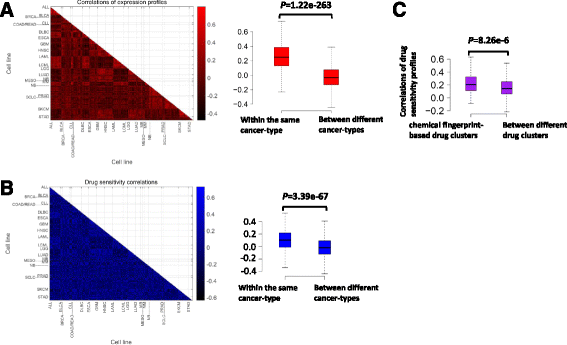
Methods: Based on the fact that similar cell lines and similar drugs exhibit similar drug responses, we adopted a similarity-regularized matrix factorization (SRMF) method to predict anticancer drug responses of cell lines using chemical structures of drugs and baseline gene expression levels in cell lines. Specifically, chemical structural similarity of drugs and gene expression profile similarity of cell lines were considered as regularization terms, which were incorporated to the drug response matrix factorization model.
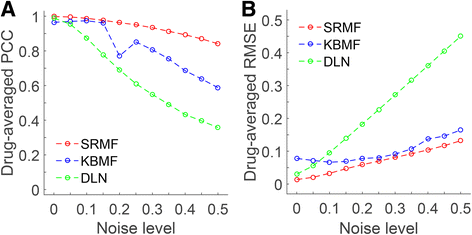
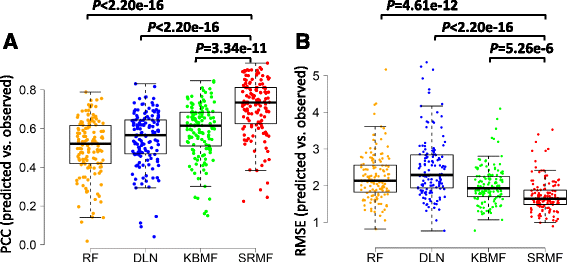
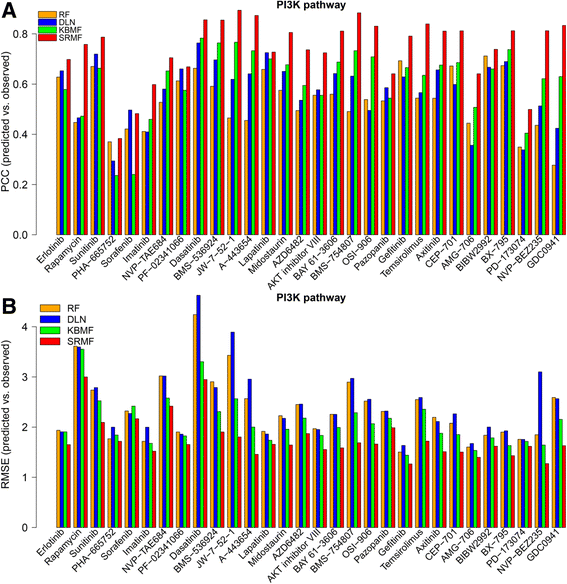
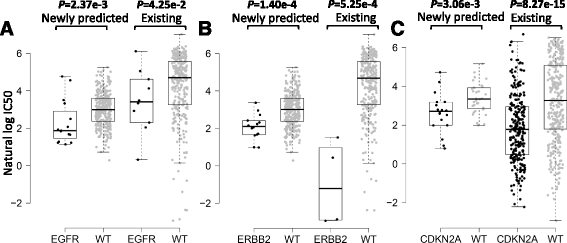
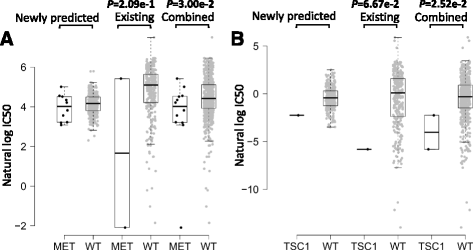
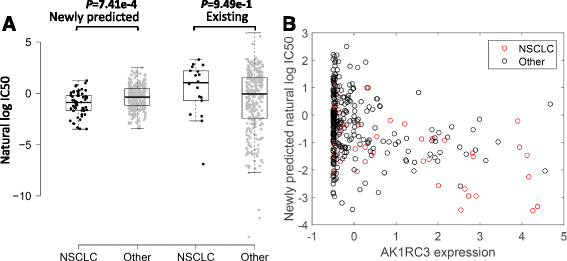
Results: We first demonstrated the effectiveness of SRMF using a set of simulation data and compared it with two typical similarity-based methods. Furthermore, we applied it to the Genomics of Drug Sensitivity in Cancer (GDSC) and Cancer Cell Line Encyclopedia (CCLE) datasets, and performance of SRMF exceeds three state-of-the-art methods. We also applied SRMF to estimate the missing drug response values in the GDSC dataset. Even though SRMF does not specifically model mutation information, it could correctly predict drug-cancer gene associations that are consistent with existing data, and identify novel drug-cancer gene associations that are not found in existing data as well. SRMF can also aid in drug repositioning. The newly predicted drug responses of GDSC dataset suggest that mTOR inhibitor rapamycin was sensitive to non-small cell lung cancer (NSCLC), and expression of AK1RC3 and HINT1 may be adjunct markers of cell line sensitivity to rapamycin.
Conclusions: Our analysis showed that the proposed data integration method is able to improve the accuracy of prediction of anticancer drug responses in cell lines, and can identify consistent and novel drug-cancer gene associations compared to existing data as well as aid in drug repositioning.
Keywords: Anticancer drug response prediction; Drug repositioning; Matrix factorization; Precision cancer medicines.
Conflict of interest statement
Ethics approval and consent to participate
Not applicable.
Consent for publication
Not applicable.
Competing interests
The authors declare that they have no competing interests.
Publisher’s Note
Springer Nature remains neutral with regard to jurisdictional claims in published maps and institutional affiliations.
Figures
Similar articles
-
Anticancer Drug Response Prediction in Cell Lines Using Weighted Graph Regularized Matrix Factorization.Mol Ther Nucleic Acids. 2019 Sep 6;17:164-174. doi: 10.1016/j.omtn.2019.05.017. Epub 2019 Jun 4. Mol Ther Nucleic Acids. 2019. PMID: 31265947 Free PMC article.
-
DSPLMF: A Method for Cancer Drug Sensitivity Prediction Using a Novel Regularization Approach in Logistic Matrix Factorization.Front Genet. 2020 Feb 27;11:75. doi: 10.3389/fgene.2020.00075. eCollection 2020. Front Genet. 2020. PMID: 32174963 Free PMC article.
-
Predicting breast cancer drug response using a multiple-layer cell line drug response network model.BMC Cancer. 2021 May 31;21(1):648. doi: 10.1186/s12885-021-08359-6. BMC Cancer. 2021. PMID: 34059012 Free PMC article.
-
Current Trends in Drug Sensitivity Prediction.Curr Pharm Des. 2016;22(46):6918-6927. doi: 10.2174/1381612822666161026154430. Curr Pharm Des. 2016. PMID: 27784247 Review.
-
Evaluation of gene-drug common module identification methods using pharmacogenomics data.Brief Bioinform. 2021 May 20;22(3):bbaa087. doi: 10.1093/bib/bbaa087. Brief Bioinform. 2021. PMID: 32591780 Review.
Cited by
-
A granularity-level information fusion strategy on hypergraph transformer for predicting synergistic effects of anticancer drugs.Brief Bioinform. 2023 Nov 22;25(1):bbad522. doi: 10.1093/bib/bbad522. Brief Bioinform. 2023. PMID: 38243692 Free PMC article.
-
Establishment and characterization of NCC-DDLPS5-C1: a novel patient-derived cell line of dedifferentiated liposarcoma.Hum Cell. 2022 May;35(3):936-943. doi: 10.1007/s13577-022-00689-2. Epub 2022 Mar 15. Hum Cell. 2022. PMID: 35292923
-
DRPreter: Interpretable Anticancer Drug Response Prediction Using Knowledge-Guided Graph Neural Networks and Transformer.Int J Mol Sci. 2022 Nov 11;23(22):13919. doi: 10.3390/ijms232213919. Int J Mol Sci. 2022. PMID: 36430395 Free PMC article.
-
Machine learning based anti-cancer drug response prediction and search for predictor genes using cancer cell line gene expression.Genomics Inform. 2021 Mar;19(1):e10. doi: 10.5808/gi.20076. Epub 2021 Mar 26. Genomics Inform. 2021. PMID: 33840174 Free PMC article.
-
MMCL-CDR: enhancing cancer drug response prediction with multi-omics and morphology images contrastive representation learning.Bioinformatics. 2023 Dec 1;39(12):btad734. doi: 10.1093/bioinformatics/btad734. Bioinformatics. 2023. PMID: 38070154 Free PMC article.
References
MeSH terms
Substances
LinkOut - more resources
Full Text Sources
Other Literature Sources
Miscellaneous

