. 2017 Aug 15;114(33):E6830-E6838.
doi: 10.1073/pnas.1708157114. Epub 2017 Jul 31.

Intraflagellar transport velocity is governed by the number of active KIF17 and KIF3AB motors and their motility properties under load

Affiliations

Intraflagellar transport velocity is governed by the number of active KIF17 and KIF3AB motors and their motility properties under load

Bojan Milic et al. Proc Natl Acad Sci U S A. .

Abstract

Homodimeric KIF17 and heterotrimeric KIF3AB are processive, kinesin-2 family motors that act jointly to carry out anterograde intraflagellar transport (IFT), ferrying cargo along microtubules (MTs) toward the tips of cilia. How IFT trains attain speeds that exceed the unloaded rate of the slower, KIF3AB motor remains unknown. By characterizing the motility properties of kinesin-2 motors as a function of load we find that the increase in KIF3AB velocity, elicited by forward loads from KIF17 motors, cannot alone account for the speed of IFT trains in vivo. Instead, higher IFT velocities arise from an increased likelihood that KIF3AB motors dissociate from the MT, resulting in transport by KIF17 motors alone, unencumbered by opposition from KIF3AB. The rate of transport is therefore set by an equilibrium between a faster state, where only KIF17 motors move the train, and a slower state, where at least one KIF3AB motor on the train remains active in transport. The more frequently the faster state is accessed, the higher the overall velocity of the IFT train. We conclude that IFT velocity is governed by (i) the absolute numbers of each motor type on a given train, (ii) how prone KIF3AB is to dissociation from MTs relative to KIF17, and (iii) how prone both motors are to dissociation relative to binding MTs.

Keywords: kinesin; molecular motors; optical trap; optical tweezers; single-molecule biophysics.


Conflict of interest statement

The authors declare no conflict of interest.

Figures

Fig. 1.
Fig. 1.
KIF17 maintains processivity under assisting and hindering loads. (A and B) Schematic representation of (A) wild-type KIF17 and (B) the truncated KIF17 construct used in this study. Shown are the motor domain (green), coiled-coil regions (CC1 and CC2; blue), C-terminal tail (orange), and His-tag (violet). (C) Graphical representation of the single-molecule optical trapping assay. Both hindering- (−; Left) and assisting-load (+; Right) experimental geometries are depicted (not to scale). (D) Step-size histogram of 549 KIF17 steps obtained under a 6-pN hindering load at saturating ATP conditions (2 mM). Distributions of forward (red; Nforward=471) and backward (burgundy; Nback=78) steps are shown, along with Gaussian fits (solid lines) and fit parameters (legend; mean ± SE). (E) Representative records of KIF17 runs under 6-pN hindering (red) and 6-pN assisting (purple) loads under saturating ATP conditions. Unfiltered records (light) are overlain by median-filtered data (dark; seven-point sliding window). (F) Expanded timescale for the assisting-load records shown in E.
Fig. 2.
Fig. 2.
Comparison of KIF17 and KIF3AB behavior under load. (A and B) Single-molecule (A) velocity and (B) randomness (solid circles; mean ± SE; N=49530) measurements as a function of applied load for KIF17 (red) and KIF3AB (blue). Data were obtained in the presence of 2 mM ATP. (C and D) Single-molecule (C) velocity and (D) randomness (solid circles; mean ± SE; N=22319) measurements as a function of ATP concentration for KIF17 (red) and KIF3AB (blue) under a constant load (legend). In all panels, solid lines represent global fits to the minimal four-state model (Fig. 3). Hindering-load and unloaded data for KIF3AB are reproduced from ref. .
Fig. S1.
Fig. S1.
ATP dependence of KIF17 motility under load. (A and B) Single-molecule KIF17 (A) velocity and (B) randomness measurements as a function of applied load (solid circles; mean ± SE; N=49552) in the presence of 2 mM (red) or 0.02 mM (orange) ATP. Solid lines, global fits to the four-state model (Fig. 3). Data for 2 mM ATP are reproduced from Fig. 2 A and B for comparison.
Fig. 3.
Fig. 3.
KIF17 and KIF3AB mechanochemical cycles captured by a four-state model. (A) A minimal four-state representation of the kinesin cycle, shown alongside (B) the partial-docking model (61), where the states and transitions in the four-state model are given specific interpretations. The first transition of the cycle, [1] → [2], which entails reversible ATP binding to the MT-bound, apo (Ø) head in the 1-HB ATP-waiting configuration, is modeled by an ATP-dependent forward rate, k1, and an ATP-independent reverse rate, k1. Once ATP binds, the NL domain partially docks to the bound head, shifting the tethered head forward, [2] → [3]: this transition is modeled by a force-dependent rate, k2(F) and corresponds to the mechanical step. Subsequent ATP hydrolysis leads to completion of NL docking, release of ADP by the tethered head, and MT binding, [3] → [4]. In the minimal model, these events are captured by a single, force-independent rate constant, k3. This transition entails passage through an implied 1-HB, posthydrolysis transition state [3], from which either (i) the tethered head binds the MT, successfully completing the step, [3] → [4], or (ii) the bound head prematurely hydrolyses ATP, resulting in motor dissociation from the MT, [3] → [4off]. Finally, the cycle is completed by Pi release and rear-head dissociation, which are jointly modeled a force-independent rate, k4. A load-independent back-stepping transition, kback, has also been incorporated. (C) Parameters (mean ± SE) obtained from global fits of KIF17 (red) and KIF3AB (blue) velocity and randomness data in Fig. 2 and Fig. S1 to the model in A.
Fig. 4.
Fig. 4.
Processivity: KIF17 and KIF3AB RLs under load. (A) KIF17 RL data (mean ± SE; N=118322) under assisting loads of 3 pN (solid bars) and 8 pN (open bars). Measurements were made in the presence of either ATP (green) or ATPγS (purple), and in the presence or absence of added KPi (orange). Buffer conditions are indicated beneath the corresponding bars. The addition of phosphate (orange) induced a statistically significant RL increase (*P0.05; t test) relative to the absence of added phosphate (green) under otherwise comparable conditions. No such increase was detected under varying nucleotide conditions in the absence of added phosphate. (B) RL measurements (solid circles; mean ± SE; N=49530) as a function of applied load for KIF17 (red) and KIF3AB (blue). Data were obtained in the presence of 2 mM ATP. Assisting- and hindering-load RL measurements were fit separately to L(F)=L0exp[|F|δL/kBT], where L0 is the unloaded RL and δL is the characteristic distance parameter. Exponential fits (lines) and corresponding L0 and δL parameters (legend; mean ± SE) are shown. Hindering-load and unloaded data for KIF3AB are reproduced from ref. .
Fig. S2.
Fig. S2.
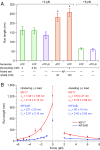
Processivity of human CL kinesin-1 is enhanced by reducing its ATP hydrolysis rate. (A) RL measurements (mean ± SE; N=118322) under assisting loads for KIF17 (red), DmK1 (purple), and HsK-CL (green). Data were collected in the presence of either ATP or ATPγS (2 mM); buffer and force conditions are specified beneath the corresponding bars. For HsK1-CL, replacing ATP with ATPγS produced a statistically significant increase in RL (**P0.01; t test). No corresponding increase was observed for KIF17 or DmK1. KIF17 measurements are the same as those in Fig. 4A; DmK1 data are reproduced from ref. . (B) RL measurements from A normalized to baseline RLs in the presence of ATP for each construct and force condition.
Fig. 5.
Fig. 5.
IFT velocities are recapitulated by simulations based on experimental parameters. (A) Dissociation rate measurements (koff; solid circles; mean ± SE; N=49530) for KIF17 (red) and KIF3AB (blue) as a function of load. Fits to dissociation rates (solid lines) were obtained by dividing fits to KIF17 and KIF3AB velocities (Fig. 2A) by the corresponding hindering- and assisting-load RL fits (Fig. 4B). Load-independent MT-binding rates (kon; dashed lines) that generated IFT velocities that best agreed with in vivo findings (10) are shown (Fig. S4). (B) Simulated IFT velocities (circles; solid line) versus distance from the ciliary base compared with in vivo data (dashed line) from Prevo et al. (10). IFT velocities tend to be overestimated (empty circles) in the TZ (<1 µm from the base) and in the distal portions of the MS (beyond ∼2.8 µm; see text). (C) The total numbers of each type of motor on an IFT train as a function of distance from the base (dashed lines), measured by Prevo et al. (10) in vivo, graphed together with the numbers of MT-bound motors (circles; solid lines) based on the simulations (Materials and Methods). (Inset) The MT-bound motor data are rescaled to show greater detail. (D) Estimated percentage of total motors that are MT-bound as a function of distance, from the data in C. In C and D, solid circles are plotted in the region between 1.0 µm and 2.8 µm from the base; the TZ and distal MS are plotted using open circles. Velocities (B) and numbers of MT-bound motors (C and D) are mean values obtained from 40 Monte Carlo simulations (20,000 transitions each) sampled at 0.1-µm spacing (Materials and Methods) with k17,on=0.258s1 and k3AB,on=0.244s1 (Fig. S4).
Fig. S3.
Fig. S3.
ATP dependence of KIF17 and KIF3AB RLs under load. (A) KIF17 RL measurements as a function of applied load (solid circles; mean ± SE; N=49552) in the presence of 2 mM (red) or 0.02 mM (orange) ATP. Solid lines represent exponential fits to assisting- and hindering-load RL measurements. The 2 mM ATP data are reproduced from Fig. 4B for ease of comparison. (B) RL measurements as a function of ATP concentration (solid circles; mean ± SE; N=22319) for KIF17 (red) and KIF3AB (blue) under a constant load (see legend). Linear fits (solid lines) to RL data are shown. The KIF3AB data are reproduced from ref. .
Fig. S4.
Fig. S4.
Simulations using experimental parameters allow estimation of MT-binding rates for kinesin-2. Contour plot displaying the normalized SSE (67) between simulated IFT velocities and those measured in vivo (10) over the region spanning 1.0 µm to 2.8 µm from the ciliary base (Fig. 5B) for a series of KIF17 (k17,on) and KIF3AB (k3AB,on) MT-binding rates (Materials and Methods). For each pair of MT-binding rates, ranging from 0.19 s−1 to 0.33 s−1, sampled at 0.001-s−1 intervals, SSE values were obtained from 40 Monte Carlo simulations (20,000 transitions each), sampled at 0.1-µm intervals. The minimum SSE (white dot), corresponding to a normalized SSE of 1.0, occurred for k17,on=0.258s1, k3AB,on=0.244s1. Uncertainties in the estimated binding rates were computed from the confidence contour at 15% above the minimum (67).
Fig. S5.
Fig. S5.
Kinesin-2 motility properties bear similarities to kinesin-1. (A) Velocity measurements as a function of applied load (solid circles; mean ± SE; N=49818) for KIF17 (red), KIF3AB (blue), and DmK1 (purple). All data were taken at 2 mM ATP. Global fits to velocity data (solid lines) are based on the four-state model. (B) RL measurements as a function of applied load (solid circles; mean ± SE; N=49818) for KIF17 (red), KIF3AB (blue), and DmK1 (purple), under the same buffer conditions. Fits to assisting- and hindering-load RL measurements (solid lines) to the function L(F)=L0exp[|F|δL/kBT] (definitions of variables are given in the main text). (C) Tabulated L0 and δL parameters for both hindering- and assisting-load regimes (mean ± SE). DmK1 data and fits (56), and hindering-load and unloaded KIF3AB measurements (40), are reproduced from previous work. Velocity and RL data, as well as associated fits, are taken from Figs. 2A and 4B.

Similar articles

Cited by

References

    1. Hirokawa N, Noda Y, Tanaka Y, Niwa S. Kinesin superfamily motor proteins and intracellular transport. Nat Rev Mol Cell Biol. 2009;10:682–696. - PubMed
    1. Hirokawa N, Niwa S, Tanaka Y. Molecular motors in neurons: Transport mechanisms and roles in brain function, development, and disease. Neuron. 2010;68:610–638. - PubMed
    1. Hirokawa N, Tanaka Y. Kinesin superfamily proteins (KIFs): Various functions and their relevance for important phenomena in life and diseases. Exp Cell Res. 2015;334:16–25. - PubMed
    1. Miki H, Setou M, Kaneshiro K, Hirokawa N. All kinesin superfamily protein, KIF, genes in mouse and human. Proc Natl Acad Sci USA. 2001;98:7004–7011. - PMC - PubMed
    1. Hancock WO. Bidirectional cargo transport: Moving beyond tug of war. Nat Rev Mol Cell Biol. 2014;15:615–628. - PMC - PubMed

Publication types

LinkOut - more resources