

Antarctic Moss Multiprotein Bridging Factor 1c Overexpression in Arabidopsis Resulted in Enhanced Tolerance to Salt Stress
- PMID: 28744295
- PMCID: PMC5504242
- DOI: 10.3389/fpls.2017.01206
Antarctic Moss Multiprotein Bridging Factor 1c Overexpression in Arabidopsis Resulted in Enhanced Tolerance to Salt Stress
Abstract
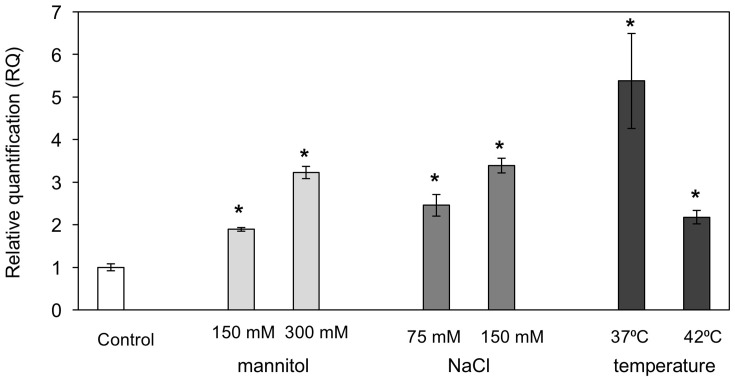
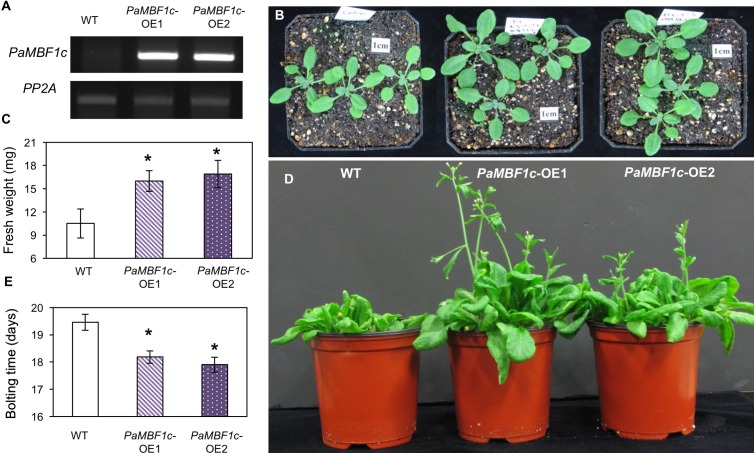
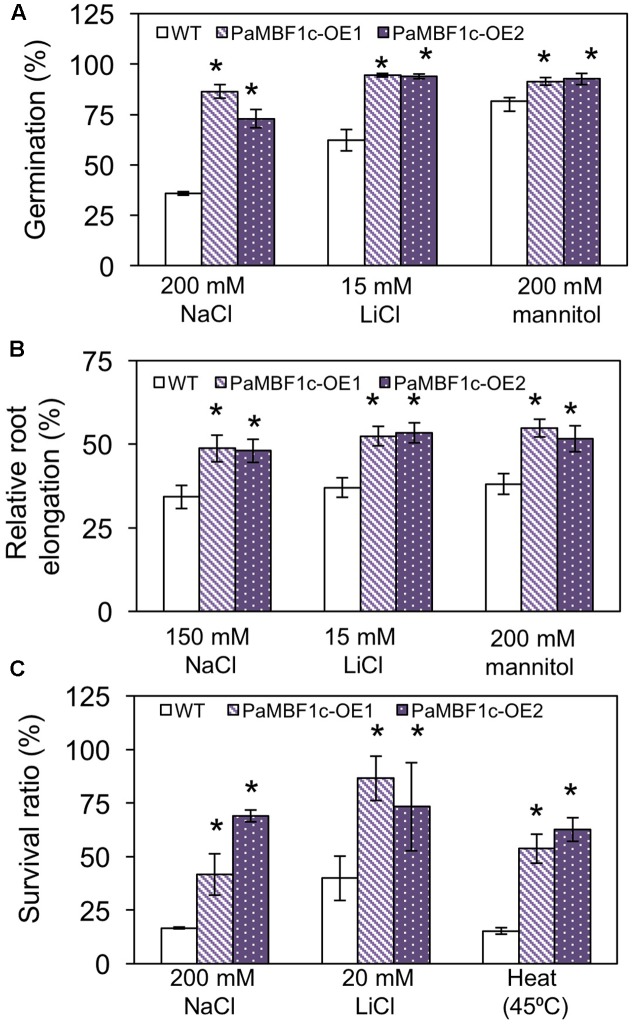
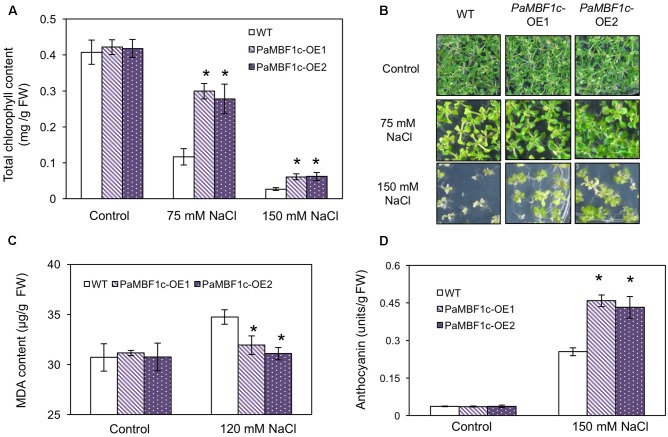
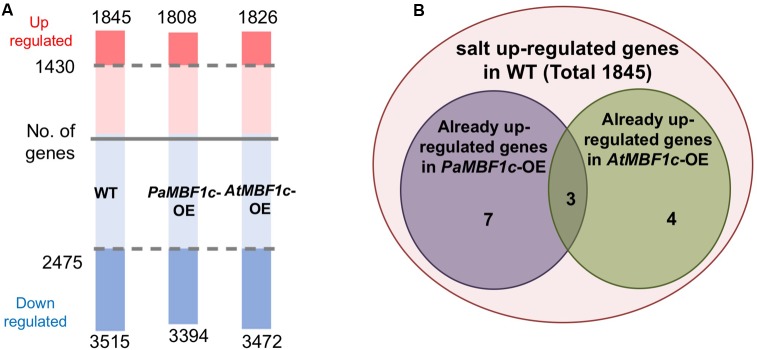
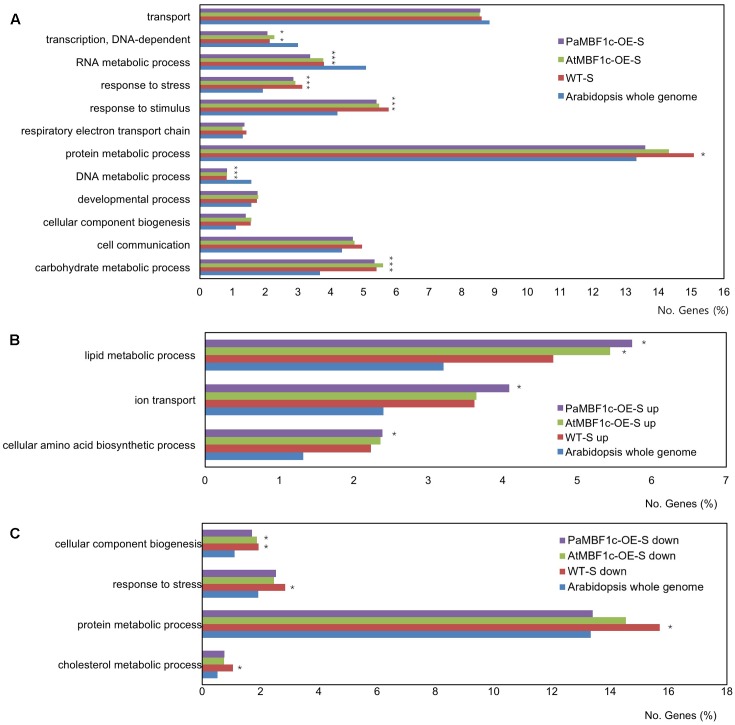
Polytrichastrum alpinum is one of the moss species that survives extreme conditions in the Antarctic. In order to explore the functional benefits of moss genetic resources, P. alpinum multiprotein-bridging factor 1c gene (PaMBF1c) was isolated and characterized. The deduced amino acid sequence of PaMBF1c comprises of a multiprotein-bridging factor (MBF1) domain and a helix-turn-helix (HTH) domain. PaMBF1c expression was induced by different abiotic stresses in P. alpinum, implying its roles in stress responses. We overexpressed PaMBF1c in Arabidopsis and analyzed the resulting phenotypes in comparison with wild type and/or Arabidopsis MBF1c (AtMBF1c) overexpressors. Overexpression of PaMBF1c in Arabidopsis resulted in enhanced tolerance to salt and osmotic stress, as well as to cold and heat stress. More specifically, enhanced salt tolerance was observed in PaMBF1c overexpressors in comparison to wild type but not clearly observable in AtMBF1c overexpressing lines. Thus, these results implicate the evolution of PaMBF1c under salt-enriched Antarctic soil. RNA-Seq profiling of NaCl-treated plants revealed that 10 salt-stress inducible genes were already up-regulated in PaMBF1c overexpressing plants even before NaCl treatment. Gene ontology enrichment analysis with salt up-regulated genes in each line uncovered that the terms lipid metabolic process, ion transport, and cellular amino acid biosynthetic process were significantly enriched in PaMBF1c overexpressors. Additionally, gene enrichment analysis with salt down-regulated genes in each line revealed that the enriched categories in wild type were not significantly overrepresented in PaMBF1c overexpressing lines. The up-regulation of several genes only in PaMBF1c overexpressing lines suggest that enhanced salt tolerance in PaMBF1c-OE might involve reactive oxygen species detoxification, maintenance of ATP homeostasis, and facilitation of Ca2+ signaling. Interestingly, many salt down-regulated ribosome- and translation-related genes were not down-regulated in PaMBF1c overexpressing lines under salt stress. These differentially regulated genes by PaMBF1c overexpression could contribute to the enhanced tolerance in PaMBF1c overexpressing lines under salt stress.
Keywords: Antarctic moss; MBF1c; Polytrichastrum alpinum; RNA sequencing; salt stress; stress tolerance.
Figures


Similar articles
-
Enhanced multiple stress tolerance in Arabidopsis by overexpression of the polar moss peptidyl prolyl isomerase FKBP12 gene.Plant Cell Rep. 2018 Mar;37(3):453-465. doi: 10.1007/s00299-017-2242-9. Epub 2017 Dec 15. Plant Cell Rep. 2018. PMID: 29247292
-
Overexpression of a Barley Aquaporin Gene, HvPIP2;5 Confers Salt and Osmotic Stress Tolerance in Yeast and Plants.Front Plant Sci. 2016 Oct 21;7:1566. doi: 10.3389/fpls.2016.01566. eCollection 2016. Front Plant Sci. 2016. PMID: 27818670 Free PMC article.
-
Enhanced tolerance to environmental stress in transgenic plants expressing the transcriptional coactivator multiprotein bridging factor 1c.Plant Physiol. 2005 Nov;139(3):1313-22. doi: 10.1104/pp.105.070110. Epub 2005 Oct 21. Plant Physiol. 2005. PMID: 16244138 Free PMC article.
-
A novel cotton WRKY gene, GhWRKY6-like, improves salt tolerance by activating the ABA signaling pathway and scavenging of reactive oxygen species.Physiol Plant. 2018 Apr;162(4):439-454. doi: 10.1111/ppl.12651. Epub 2017 Nov 29. Physiol Plant. 2018. PMID: 29027659
-
The Miscanthus NAC transcription factor MlNAC9 enhances abiotic stress tolerance in transgenic Arabidopsis.Gene. 2016 Jul 15;586(1):158-69. doi: 10.1016/j.gene.2016.04.028. Epub 2016 Apr 13. Gene. 2016. PMID: 27085481
Cited by
-
Overexpression of a Multiprotein Bridging Factor 1 Gene DgMBF1 Improves the Salinity Tolerance of Chrysanthemum.Int J Mol Sci. 2019 May 17;20(10):2453. doi: 10.3390/ijms20102453. Int J Mol Sci. 2019. PMID: 31108974 Free PMC article.
-
The plant MBF1 protein family: a bridge between stress and transcription.J Exp Bot. 2020 Mar 25;71(6):1782-1791. doi: 10.1093/jxb/erz525. J Exp Bot. 2020. PMID: 32037452 Free PMC article. Review.
-
Transcriptional network underpinning ploidy-related elevated leaf potassium in neo-tetraploids.Plant Physiol. 2022 Oct 27;190(3):1715-1730. doi: 10.1093/plphys/kiac360. Plant Physiol. 2022. PMID: 35929797 Free PMC article.
-
Integration between ROS Regulatory Systems and Other Signals in the Regulation of Various Types of Heat Responses in Plants.Int J Mol Sci. 2018 Oct 28;19(11):3370. doi: 10.3390/ijms19113370. Int J Mol Sci. 2018. PMID: 30373292 Free PMC article. Review.
-
The genetic orchestra of salicylic acid in plant resilience to climate change induced abiotic stress: critical review.Stress Biol. 2024 Jun 17;4(1):31. doi: 10.1007/s44154-024-00160-2. Stress Biol. 2024. PMID: 38880851 Free PMC article. Review.
References
-
- Arce D. P., Tonon C., Zanetti M. E., Godoy A. V., Hirose S., Casalongue C. A. (2006). The potato transcriptional co-activator StMBF1 is up-regulated in response to oxidative stress and interacts with the TATA-box binding protein. J. Biochem. Mol. Biol. 39 355–360. 10.5483/bmbrep.2006.39.4.355 - DOI - PubMed
-
- Ashton N. W., Cove D. J. (1977). The isolation and preliminary characterisation of auxotrophic and analogue resistant mutants of the moss, Physcomitrella patens. Mol. Gen. Genet. 154 87–95. 10.1007/BF00265581 - DOI
LinkOut - more resources
Full Text Sources
Other Literature Sources
Molecular Biology Databases
Miscellaneous