. 2017 Jul 11:8:805.
doi: 10.3389/fimmu.2017.00805. eCollection 2017.

CCR6 Deficiency Impairs IgA Production and Dysregulates Antimicrobial Peptide Production, Altering the Intestinal Flora

Affiliations

CCR6 Deficiency Impairs IgA Production and Dysregulates Antimicrobial Peptide Production, Altering the Intestinal Flora

Ya-Lin Lin et al. Front Immunol. .

Abstract

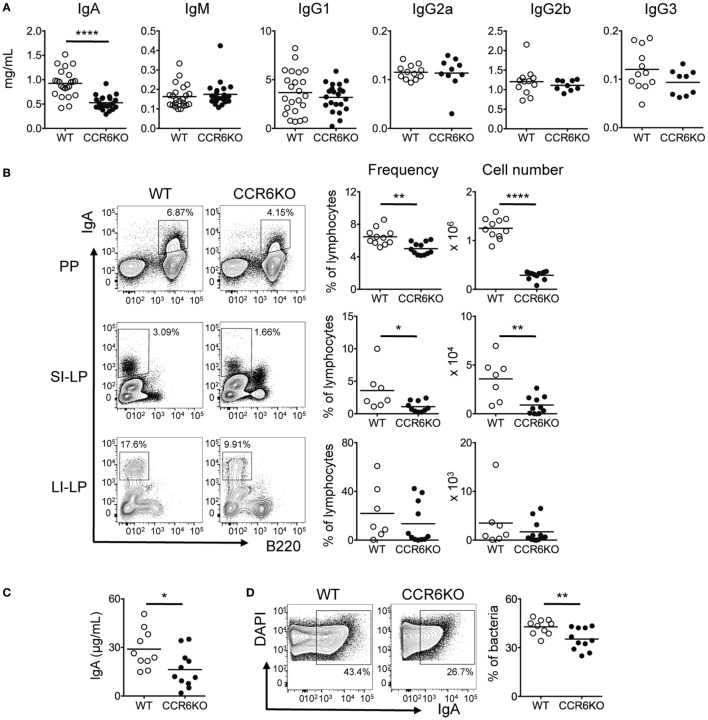
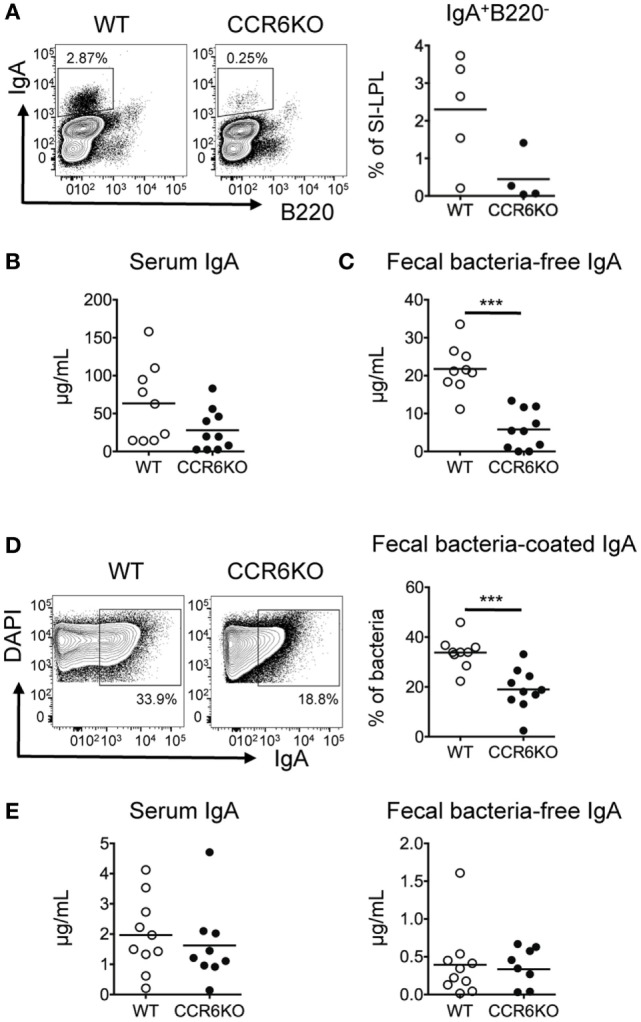
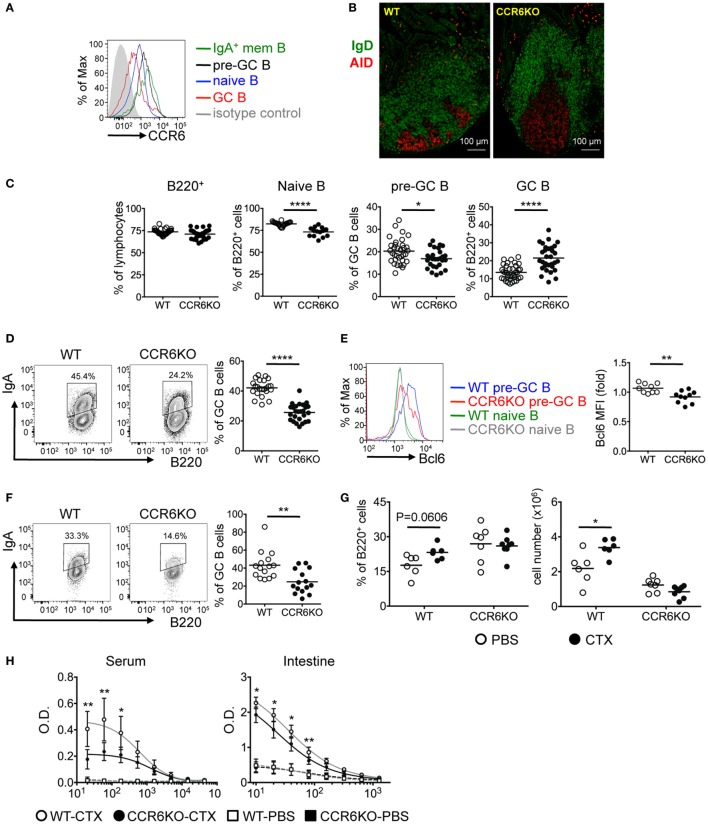
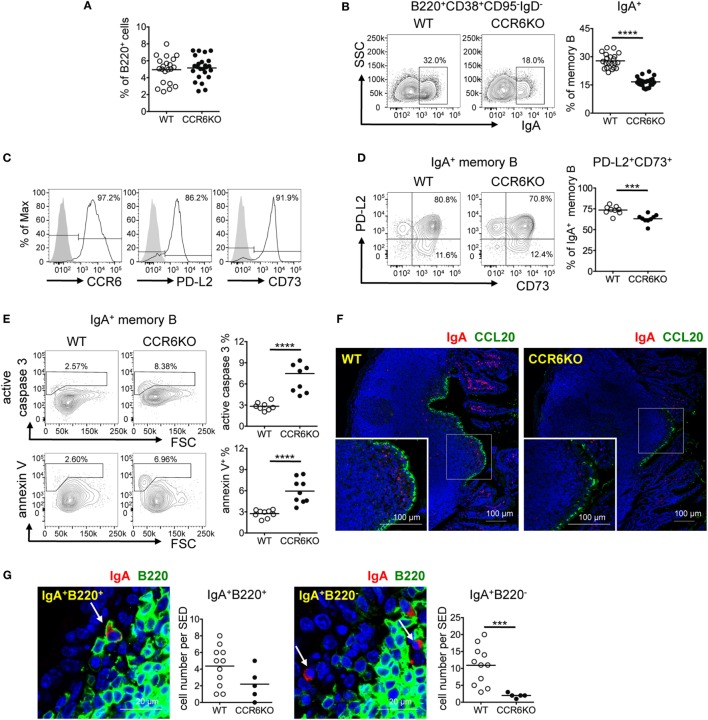
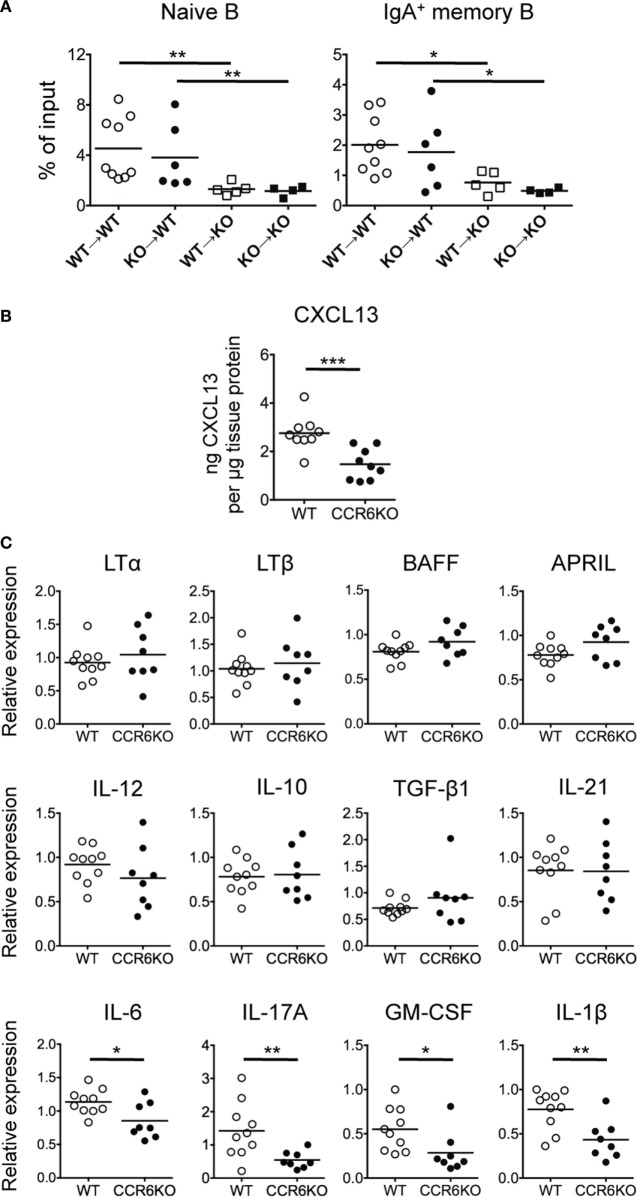
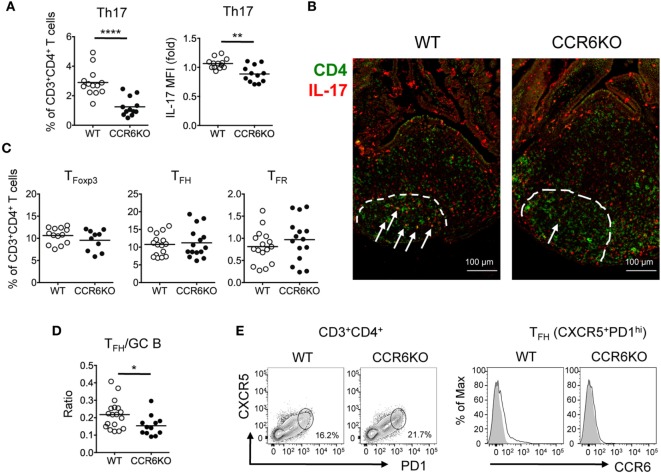
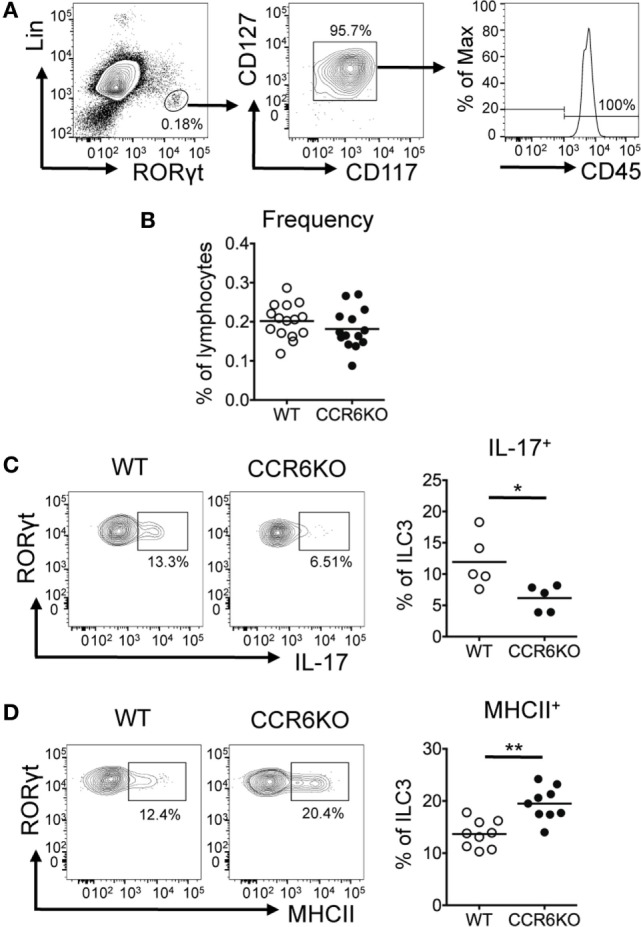
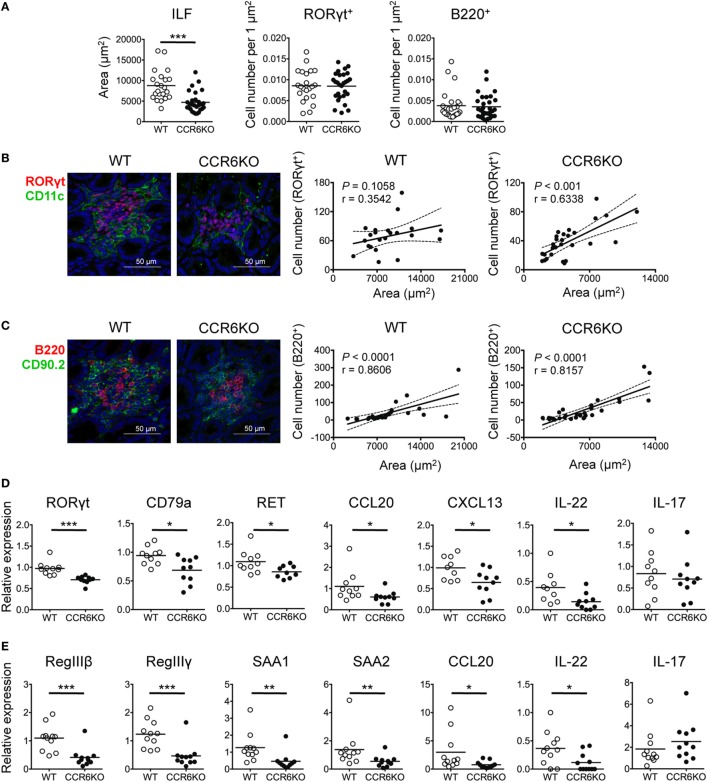
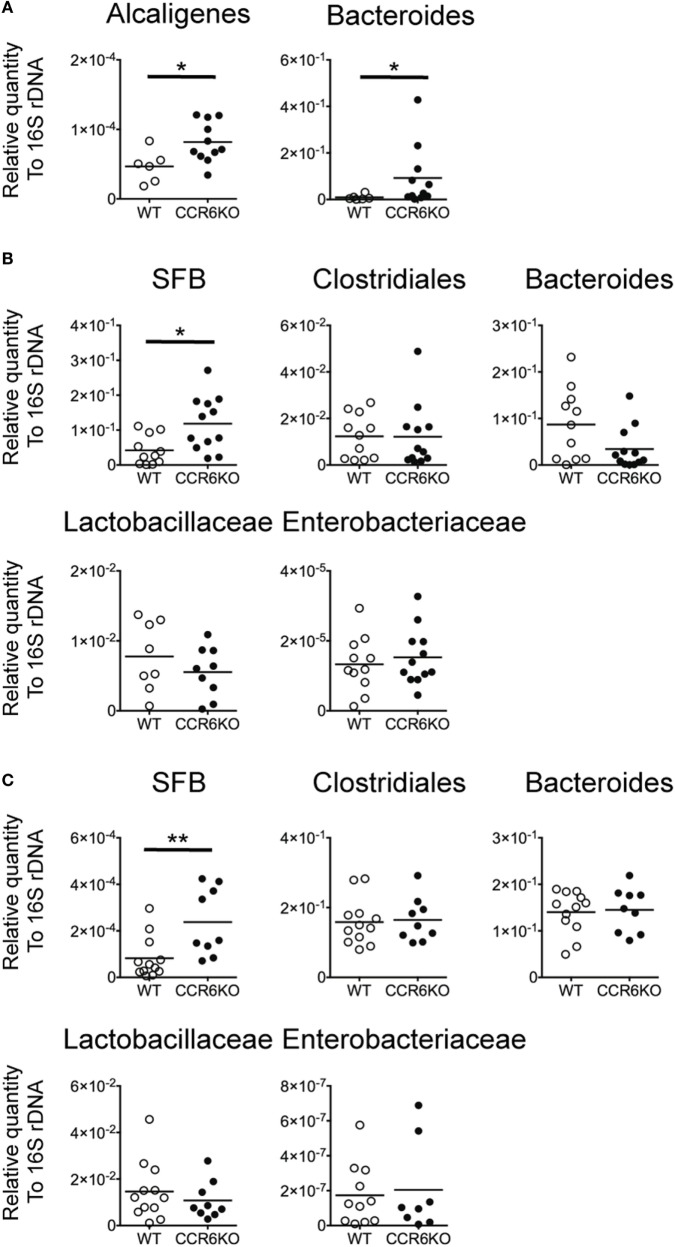
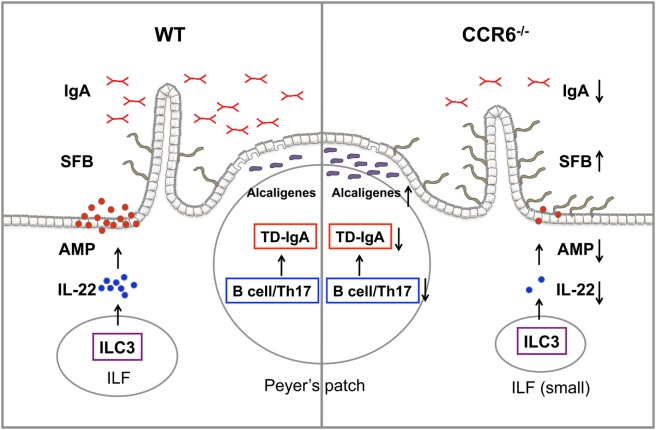
Intestinal immunity exists as a complex relationship among immune cells, epithelial cells, and microbiota. CCR6 and its ligand-CCL20 are highly expressed in intestinal mucosal tissues, such as Peyer's patches (PPs) and isolated lymphoid follicles (ILFs). In this study, we investigated the role of the CCR6-CCL20 axis in intestinal immunity under homeostatic conditions. CCR6 deficiency intrinsically affects germinal center reactions in PPs, leading to impairments in IgA class switching, IgA affinity, and IgA memory B cell production and positioning in PPs, suggesting an important role for CCR6 in T-cell-dependent IgA generation. CCR6 deficiency impairs the maturation of ILFs. In these follicles, group 3 innate lymphoid cells are important components and a major source of IL-22, which stimulates intestinal epithelial cells (IECs) to produce antimicrobial peptides (AMPs). We found that CCR6 deficiency reduces IL-22 production, likely due to diminished numbers of group 3 innate lymphoid cells within small-sized ILFs. The reduced IL-22 levels subsequently decrease the production of AMPs, suggesting a critical role for CCR6 in innate intestinal immunity. Finally, we found that CCR6 deficiency impairs the production of IgA and AMPs, leading to increased levels of Alcaligenes in PPs, and segmented filamentous bacteria in IECs. Thus, the CCR6-CCL20 axis plays a crucial role in maintaining intestinal symbiosis by limiting the overgrowth of mucosa-associated commensal bacteria.

Keywords: CCR6; IgA; Peyer’s patch; antimicrobial peptide; isolated lymphoid follicle.


Figures

Figure 1
Figure 1
CCR6−/− mice show reduced IgA production. (A) Sera from WT and CCR6−/− littermates were analyzed for immunoglobulin subtypes using ELISA. (B) Lymphocytes isolated from Peyer’s patches (PPs), SI-LP, and LI-LP were subjected to FACS analysis of surface IgA and B220. The frequency and absolute number of IgA-bearing cells are shown. (C,D) Mouse feces were collected from the cecum, weighed, and homogenized in PBS-containing protease inhibitors. The homogenates were subjected to consecutive centrifugations to separate bacteria from bacteria-free supernatants. Bacteria-free supernatants were subjected to the analysis of IgA with ELISA (C). Cecal bacteria were subjected to FACS analysis of IgA-coated bacteria (D). Each symbol represents one mouse. Data are a compilation of three to five (A) or three independent experiments (B–D) (*p < 0.05; **p < 0.01; ****p < 0.0001).
Figure 2
Figure 2
CCR6 deficiency intrinsically affects the generation of T cell-dependent IgA. Peyer’s patch (PP) naive B cells (2 × 106) isolated from WT and CCR6−/− mice were transferred to JH−/− recipient mice via retro-orbital injection. (A) Recipient mice were sacrificed 2 weeks post-transfer, and SI-LP lymphocytes were subjected to FACS analysis of surface IgA and B220. (B,C) Serum (B) and fecal (C) IgA levels in the recipient mice were measured by ELISA. (D) Fecal bacteria were subjected to FACS analysis of IgA-coated bacteria. (E) PP naive B cells (2 × 106) isolated from WT and CCR6−/− mice were transferred to Rag1−/− recipient mice. Serum IgA (left panel) and fecal IgA (right panel) were analyzed 2 weeks post-transfer. Each symbol represents one mouse. Data are a compilation of two (A) or three (B–E) independent experiments (***p < 0.001).
Figure 3
Figure 3
CCR6−/− mice show enlarged GC and fewer IgA-bearing germinal centers (GC) B cells in Peyer’s patches (PPs). (A) CCR6 expression on B-cell subsets in PPs was determined by FACS analysis. B cell subsets analyzed are naive B cells (B220+CD38+CD95IgD+), pre-GC B cells (B220+CD95+PNAhiIgD+), GC B cells (B220+CD95+PNAhiIgD), and IgA+ memory B cells (B220+CD38+CD95IgDIgA+). (B) Cryosections of PPs from WT and CCR6−/− mice. Sections were stained with AID (red) and IgD (green). PPs from two WT mice and two CCR6−/− were processed and examined. Representative PPs from the distal part of small intestine are shown. (C) FACS analysis of B-cell subsets in PPs of WT and CCR6−/− mice. The frequencies of total B cells (B220+), naive B cells (B220+CD95PNAintIgD+IgM+), pre-GC B cells (B220+CD95+PNAhiIgD+), and GC B cells (B220+CD95+PNAhi) are shown. (D) PP lymphocytes from WT and CCR6−/− mice were subjected to FACS analysis of IgA-bearing GC B cells (B220+CD95+CD38IgA+). Representative contour plots (left panel) and the frequency (right panel) of IgA-bearing GC B cells are shown. (E) PP lymphocytes from WT and CCR6−/− mice were subjected to FACS analysis of pre-GC B cells (B220+CD95+PNAhiIgD+) along with intracellular staining of Bcl6. A representative histogram is shown (left panel), and the mean fluorescence intensity (MFI) of Bcl6 is shown (right panel). (F) Irradiated Rag1−/− mice were reconstituted with mixed bone marrow from WT and CCR6−/− mice (1:1). Three months later, PP lymphocytes were isolated and analyzed for IgA-bearing GC B cells. Representative contour plots (left panel) and the frequency (right panel) of IgA-bearing GC B cells are shown. (G,H) WT and CCR6−/− mice were orally immunized with 10 µg of cholera toxin (CTX) three times with 7 days intervals. Mice were sacrificed on day 7 after final immunization. PP lymphocytes were subjected to FACS analysis of GC B cells (B220+CD95+PNAhi). The frequency (left panel) and number (right panel) of GC B cells are shown (G). Mouse sera were adjusted to an equal IgA concentration (100 mg/ml), and intestinal tissue extracts were adjusted to an equal protein concentration (5 mg/ml). Sera and intestinal samples were serially diluted, followed by measurement of anti-CTX IgA with ELISA (H). Each symbol represents one mouse. Data are a compilation of six (C), four (D,E), three (F), or two (G,H) independent experiments (*p < 0.05; **p < 0.01; ****p < 0.0001).
Figure 4
Figure 4
CCR6−/− mice show decreased IgA-bearing memory B cells in Peyer’s patches (PPs). (A–E) PP lymphocytes from WT and CCR6−/− mice were subjected to FACS analysis of memory B cells. The frequencies of total memory B cells (B220+CD38+CD95IgD) (A) and IgA-bearing memory B cells (B) are shown. Representative histograms indicating the expression of CCR6, PD-L2, and CD73 on IgA-bearing memory B cells are shown (C). Representative contour plots (left panel) and the frequency of PD-L2 and CD73 double-positive, IgA-bearing memory B cells in WT and CCR6−/− mice (right panel) are shown (D). Representative contour plots and the frequency of IgA-bearing memory B cells positive for active caspase 3 and annexin V in WT and CCR6−/− mice are shown (E). (F,G) Sections of paraffin-embedded PPs from WT and CCR6−/− mice were subjected to immunofluorescence assay (IFA) for the detection of IgA (red) and CCL20 (green) (F) or IgA (red) and B220 (green) (G). PPs from four mice (WT n = 2, CCR6−/− n = 2) were processed and examined. Representative IFAs from cryosection of the distal part of small intestine are shown (F). IgA+B220+ cells (left panel) and IgA+B220 cells (right panel) in the subepithelial dome (SED) of WT PPs are shown. The quantification of the IgA-bearing cells was performed by counting cells within the SED, which is depicted as a more diffuse area immediately underneath follicle-associated epithelium. The results obtained from one pair of WT and CCR6−/− mice are shown (G). Each symbol represents one mouse (A–E). Each symbol represents one SED (G). Data are a compilation of six (A,B), two (D), or three (E) independent experiments (***p < 0.001; ****p < 0.0001).
Figure 5
Figure 5
The Peyer’s patch (PP) milieu determines B cells trafficking toward PPs. (A) PP lymphocytes (1 × 107) from WT and CCR6−/− mice were adoptively transferred into recipient mice with different CD45 congenital markers. Recipient mice were sacrificed 48 h post-transfer, and PP lymphocytes were subjected to FACS analysis of donor naive B cells and donor IgA-bearing memory B cells. (B) Concentrations of CXCL13 in PP homogenates from WT and CCR6−/− mice were determined by ELISA and normalized to the concentrations of total tissue protein. (C) The expression of various genes in PPs of WT and CCR6−/− mice was determined by quantitative PCR. Relative gene expression was normalized to the level of GAPDH and compared to the expression in WT mice. Each symbol represents one mouse. Data are a compilation of three (A,B) or three to four (C) independent experiments (*p < 0.05; **p < 0.01; ***p < 0.001).
Figure 6
Figure 6
CCR6−/− mice show significantly reduced Th17 cells in Peyer’s patches (PPs). (A) PP lymphocytes were subjected to FACS analysis of Th17 cells (CD3+CD4+IL-17+). The frequency of Th17 in T helper cells (left panel) and the mean fluorescence intensity of IL-17 in Th17 cells (right panel) are shown. (B) Representative immunofluorescence assay of CD4 (green) and IL-17 (red) from paraffin-embedded PPs of WT and CCR6−/− mice are shown. Dash lines indicate GC boundary. Arrows indicate CD4+IL-17+ double-positive cells within germinal centers (GC). (C) FACS analysis of PP lymphocytes. The frequencies of TFoxp3 (CD3+CD4+Foxp3+), TFH (CD3+CD4+CXCR5+PD1+), and TFR (CD3+CD4+CXCR5+PD1+Foxp3+) cells are shown. (D) PP lymphocytes from WT and CCR6−/− mice were prepared and subjected to FACS analysis for detecting TFH (CD3+CD4+CXCR5+PD1+) and GC B (B220+CD95+PNAhi) cells. The absolute cell number of TFH and GC B cells was calculated. The ratio of TFH/GC B was calculated by dividing the absolute cell number of TFH cells by the absolute cell number of GC B cells. (E) Representative contour plots of TFH cells (CD3+CD4+CXCR5+PD1+) in PPs (left panel) and representative histograms of CCR6 expression on TFH cells (right panel) are shown. Each symbol represents one mouse. Data are a compilation of six (A), four (C), or three (D) independent experiments (**p < 0.01; ****p < 0.0001).
Figure 7
Figure 7
ILC3s show significantly decreased IL-17 expression but significantly increased MHCII expression in Peyer’s patches (PPs) of CCR6−/− mice. PP lymphocytes were subjected to immunofluorescence staining of surface markers (Lin, CD45, CD117, CD127, and MHCII) followed by intracellular staining of RORγt. (A) Representative contour plots for the identification of ILC3–LTi (LinRORγt+CD117+CD127+) in PPs are shown. (B) The frequency of ILC3–LTi in PPs of WT and CCR6−/− mice is shown. (C) PP lymphocytes were stimulated with 20 µg/ml PMA, 1 µM ionomycin, and 5 µg/ml brefeldin A for 4 h followed by surface staining of ILC3–LTi and intracellular staining of IL-17 and RORγt. The frequency of IL-17-producing ILC3–LTi in PPs of WT and CCR6−/− mice is shown. (D) The frequency of MHCII-expressing ILC3–LTi in PPs of WT and CCR6−/− mice is shown. Each symbol represents one mouse. Data are a compilation of six (B), three (C), or four (D) independent experiments (*p < 0.05; **p < 0.01).
Figure 8
Figure 8
CCR6−/− mice show small-sized isolated lymphoid follicles (ILFs) and reduced expression of genes involved in epithelial defense. (A–C) Cryosections of ileum from WT and CCR6−/− mice were subjected to immunofluorescence assay (IFA) to detect ILFs. ILFs were defined as lymphoid aggregates with surface areas between 2,000 and 20,000 µm2. ILFs were stained for RORγt (red) and CD11c (green) [(B), left panel] or B220 (red), CD90.2 (green), and CD3e (no signal, data not shown) [(C), left panel]. Quantification of ILF surface areas [(A), left panel] and the frequencies of RORγt+ cells and B220+ cells in ILFs are shown [(A), middle and right panels]. (B,C) Representative IFA of ILFs in the ilea of WT and CCR6−/− mice are shown [(B,C), both left panel]. The scatter plots show the correlation between RORγt-expressing cells and ILF surface area in WT [(B), middle panel] or CCR6−/− [(B), right panel] mice. The scatter plots show the correlation between B220-expressing cells and ILF surface area in WT [(C), middle panel] or CCR6−/− [(C), right panel] mice. The number of RORγt+ cells or B220+ cells was counted in a given area of tissue sections from two mice in each group; the data shown are the results of Spearman correlation test with regression line (solid line), 95% confidence interval (dashed line), P value, and correlation coefficient (r). Each symbol represents one ILF. (D,E) Total RNA extracted from ileum scrapes and crypts of WT and CCR6−/− mice was subjected to reverse transcription into cDNA followed by quantitative PCR analysis. Relative gene expression was normalized to the level of GAPDH and compared to expression in WT mice. The expression of various genes in crypts (D) and scrapes (E) is shown. Each symbol represents one mouse. Data are a compilation of three (D) or four (E) independent experiments (*p < 0.05; **p < 0.01; ***p < 0.001; ****p < 0.0001).
Figure 9
Figure 9
CCR6 deficiency results in the altered intestinal flora. Peyer’s patches (PPs), ileal scrapes, and cecal feces were collected from WT and CCR6−/− mice. Genomic DNA was purified from the tissues and feces. The levels of indicated bacteria species were analyzed by quantitative PCR using primers specific to Alcaligenes, Bacteroides, Clostridiales, segmented filamentous bacteria, Lactobacillaceae, and Enterobacteriaceae. The quantitative results were normalized to universal 16S rDNA. The levels of indicated bacterial species in PPs (A), ileal scrapes (B), and feces (C) are shown. Each symbol represents one mouse. Data are a compilation of three (A,B) or four (C) independent experiments (*p < 0.05; **p < 0.01).
Figure 10
Figure 10
The summary of CCR6 deficiency leading to the altered intestinal flora. CCR6 deficiency affects T-cell-dependent IgA (TD-IgA) production in PPs and antimicrobial peptide (AMP) production in intestinal epithelial cells, leading to an increase of segmented filamentous bacteria and Alcaligenes, and subsequently to the perturbations of intestinal homeostasis.

Similar articles

Cited by

References

    1. Artis D. Epithelial-cell recognition of commensal bacteria and maintenance of immune homeostasis in the gut. Nat Rev Immunol (2008) 8:411–20.10.1038/nri2316 - DOI - PubMed
    1. Hooper LV, Littman DR, Macpherson AJ. Interactions between the microbiota and the immune system. Science (2012) 336:1268–73.10.1126/science.1223490 - DOI - PMC - PubMed
    1. Mazanec MB, Kaetzel CS, Lamm ME, Fletcher D, Nedrud JG. Intracellular neutralization of virus by immunoglobulin A antibodies. Proc Natl Acad Sci U S A (1992) 89:6901–5.10.1073/pnas.89.15.6901 - DOI - PMC - PubMed
    1. Lycke N, Eriksen L, Holmgren J. Protection against cholera toxin after oral immunization is thymus-dependent and associated with intestinal production of neutralizing IgA antitoxin. Scand J Immunol (1987) 25:413–9.10.1111/j.1365-3083.1987.tb02208.x - DOI - PubMed
    1. Cash HL, Whitham CV, Behrendt CL, Hooper LV. Symbiotic bacteria direct expression of an intestinal bactericidal lectin. Science (2006) 313:1126–30.10.1126/science.1127119 - DOI - PMC - PubMed