. 2017 Aug 3;67(3):411-422.e4.
doi: 10.1016/j.molcel.2017.06.027. Epub 2017 Jul 20.

Genome-wide Single-Molecule Footprinting Reveals High RNA Polymerase II Turnover at Paused Promoters

Affiliations

Genome-wide Single-Molecule Footprinting Reveals High RNA Polymerase II Turnover at Paused Promoters

Arnaud R Krebs et al. Mol Cell. .

Abstract

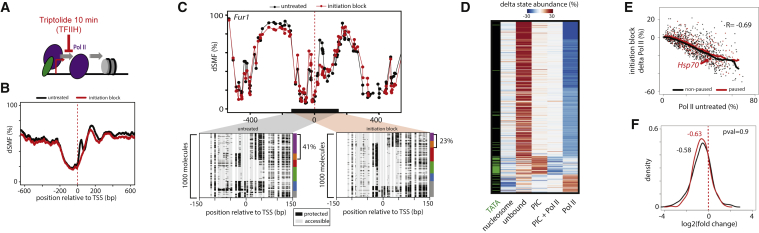
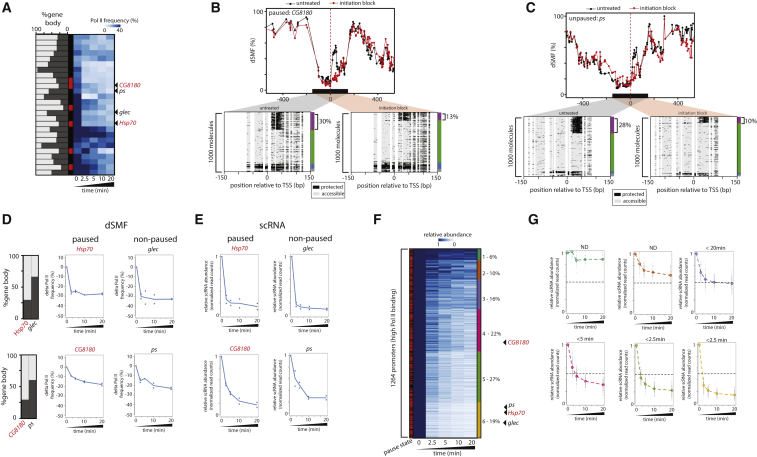
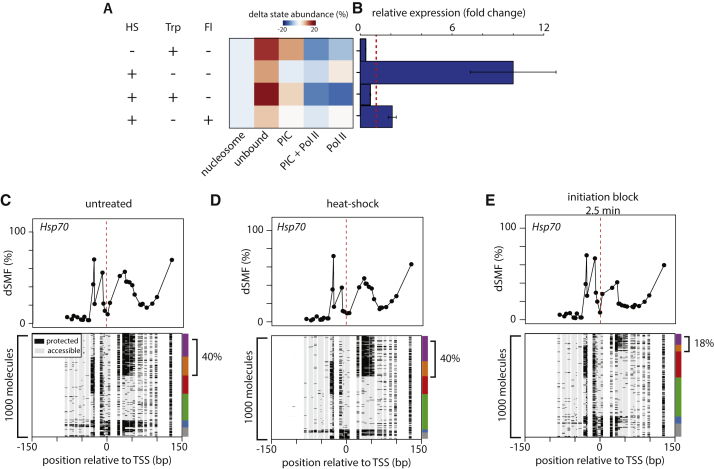
Transcription initiation entails chromatin opening followed by pre-initiation complex formation and RNA polymerase II recruitment. Subsequent polymerase elongation requires additional signals, resulting in increased residence time downstream of the start site, a phenomenon referred to as pausing. Here, we harnessed single-molecule footprinting to quantify distinct steps of initiation in vivo throughout the Drosophila genome. This identifies the impact of promoter structure on initiation dynamics in relation to nucleosomal occupancy. Additionally, perturbation of transcriptional initiation reveals an unexpectedly high turnover of polymerases at paused promoters-an observation confirmed at the level of nascent RNAs. These observations argue that absence of elongation is largely caused by premature termination rather than by stable polymerase stalling. In support of this non-processive model, we observe that induction of the paused heat shock promoter depends on continuous initiation. Our study provides a framework to quantify protein binding at single-molecule resolution and refines concepts of transcriptional pausing.

Keywords: DNA footprinting; GTF; TBP; genomics; single molecule; transcription; transcriptional pausing.


Figures

None
Graphical abstract
Figure 1
Figure 1
High-Resolution Genomic Footprinting Detects Non-nucleosomal Binding Events (A) Overview of dual-enzyme single-molecule footprinting (dSMF). Nuclei are isolated and incubated with recombinant cytosine methyl-transferases that target GpC (M.CviPI) and CpG (M.SssI). DNA bound by proteins is protected from methyltransferase activity (GpC, purple lollipops; CpG, blue lollipops), which results in distinct footprints of methylation (unmethylated, white lollipops). Combined treatment with both enzymes increases footprint resolution (∼7 bp). Resulting methylation is detected by whole-genome bisulfite sequencing at single-molecule and base-pair resolution. Sequencing is done with long reads (300 bp) to cover regions of interest within the same molecule. (B) dSMF footprinting pattern of a 30-kb chromosomal region illustrating increased accessibility at regulatory regions. Shown is the inverse frequency of methylation (1-methylation (%)) (black line). Read counts for additional datasets are shown as smoothed signal (colored lines, datasets as indicated). Shaded green boxes indicate regions of increased accessibility as determined by DNase hypersensitivity (DHS). (C) Zoom-in centered on the start site of the transcribed Dgp1 gene illustrating the presence of a non-nucleosomal footprint at the site of Pol II accumulation downstream of the TSS. Same tracks as in (B) except dSMF where the inverted methylation average for single cytosines is represented by black dots connected by a line. Position of the +1 nucleosome indicated by blue box, position of Pol II accumulation by purple box. (D and E) Composite profile of footprinting signals at TSSs (dashed red line) of (D) active genes (top 10%, Pol II ChIP-seq) and (E) inactive genes (bottom 10%). Shown is the footprinting frequency (1-methylation [%]) of individual cytosines (black dots). The average MNase signal for the same regions is overlaid (light-blue line indicating MNase 5′ cut site). Note the footprint downstream of the TSSs of active genes that is not accounted for by nucleosomes. (F and G) The non-nucleosomal footprint downstream of TSSs aligns with the site of Pol II accumulation. Shown are the averaged accessibility signal (black line), average Pol II occupancy (ChIP-seq, purple), and activity (PRO-seq, brown) for (F) active genes and (G) inactive genes as defined in (D) and (E).
Figure 2
Figure 2
Pattern Decomposition into Discrete States of Transcriptional Initiation (A) Single-molecule decomposition of footprinting signals over a single active promoter. Upper panel: graphic representation of promoter elements of the CG45186 gene. Middle panel: shown is the average footprint for single cytosines (black dots connected by a line, red line, TSS). Lower panel: stack of individual molecule reads illustrating the discrete distribution of accessible (methylated Cs, light gray) and protected regions (unmethylated Cs, black). DNA molecules measured by targeted amplicon bisulfite sequencing are organized by hierarchical clustering. Distribution of footprints illustrates the heterogeneity in protein binding at a single promoter within a population of cells. (B) Average footprinting patterns centered on the TSS of the 10% most active promoters. (C) Illustration of the strategy used to assign discrete states from dSMF datasets. Four bins anchored relative to core promoter elements were used to extract methylation from every sequenced molecule. Methylation was binarized within each bin creating a 4-bit vector leading to 16 possible combinations describing the state of each molecule. Five footprinting patterns were selected and defined as states (see STAR Methods). (D) Average footprinting patterns of the five states (colored lines) centered on the TSS of active promoters computed after single-molecule separation. Sequencing reads were classified into five pre-defined states, and the average footprinting frequency was calculated for each covered position across the set of active promoters. (E) Spatial alignment of footprinting signal with polymerase downstream of the TSSs (brown box) or positioned nucleosomes (blue box) across the same set of promoters. Average read count signal across active promoters is displayed for independent measurements. (F) Global relation between state frequencies at promoters and independent bulk measurements of Pol II and nucleosomes depicted in form of a heatmap of similarity (Pearson correlation). States separate in two groups that either correlate with occupancy by the transcription machinery (Pol II ChIP-seq) or nucleosomes (MNase-seq) illustrating accurate state quantification. (G) Distribution of state frequencies as a function of promoter activity. Cumulative bar plot depicting the distribution of state frequencies. Promoters were binned based on Pol II enrichment (log2 ChIP-seq), and the median frequency of each state was calculated within each bin. The frequency of each state is represented using the same color code as in (D). For comparison median expression (RNA-seq; reads per kilobase per million reads [RPKM]) is displayed (upper panel, white to black scale). A sharp decrease in nucleosome occupancy is observed between silent and lowly expressed genes, concomitant with a mirroring increase in unoccupied molecules. Promoters with increasing transcriptional activity display a reduction of unbound molecules concomitant with increasing Pol-II-bound molecules at a constant nucleosomal occupancy rate (∼10%). (H) Single-locus examples of a weakly active promoter (left panel, Roh-Pol II fold enrichment 9×) versus a highly active promoter (right panel, IP3K1-Pol II fold enrichment 36×). Shown are stacks of individual molecules measured by targeted amplicon bisulfite sequencing, sorted into five states using the classification algorithm (methylated Cs, accessible, light gray; unmethylated Cs, protected, black). The vertical side bar depicts the frequency of each state using the same color code as 2D. The percentages of molecules in the Pol II or unbound state are indicated at the right side of the plot.
Figure 3
Figure 3
TATA Box Stabilizes Binding of the PIC (A and B) Single-locus examples of TATA-less (A) versus TATA-containing (B) promoters. Shown are average methylation levels (top panel, black dots connected by a black line) and single-molecule stacks measured by targeted amplicon bisulfite sequencing, sorted into five states using the classification algorithm (methylated Cs, accessible, light gray; unmethylated Cs, protected, black). The vertical side bar depicts the frequency of each state using the same color code as in 2D. Red dashed line depicts position of the TSSs. The percentages of molecules in PIC- or Pol-II-bound states are indicated on the right side of the plot. (C) Composite footprinting profiles around TATA-containing or TATA-less highly active promoters (red and blue lines, respectively) showing strong differences in PIC footprints between the categories. (D) Heatmap showing state frequencies for transcriptionally active promoters. k-means clustering was used to organize the heatmap. Side bars indicate presence (colored) or absence (black) of core promoter elements, revealing that TATA-containing promoters cluster due to the increased abundance of PIC footprint. (E) TATA-box presence alters state distribution, depleting accessible molecules and increasing the number of molecules bound by PIC (with or without Pol II binding). Shown are p values (–log) of a Wilcoxon rank-sum test multiplied by the sign of the statistic parameter to account for directionality of the differences.
Figure 4
Figure 4
Blocking Transcriptional Initiation Changes Pol II Occupancy (A) Schematic representation of the initiation process and its block through chemical inhibition of XPB-TFIIH with Triptolide. (B) Composite footprinting profile around the top 10% expressed genes (as in Figure 1D) before and after Triptolide treatment for 10 min (black and red lines, respectively). Note the decrease of footprint downstream of TSS. (C) Effect of inhibition of transcription initiation exemplified at the TATA-containing Fur1 promoter. Displayed are average methylation levels before and after inhibition (top panel, black dots [untreated]; red dots [initiation inhibition] connected by a line). The single-molecule stacks for untreated (left panel) versus 10-min treatment (right panel) display footprints measured by targeted amplicon bisulfite sequencing, sorted into five states using the classification algorithm (methylated Cs, accessible, light gray; unmethylated Cs, protected, black). The vertical side bar depicts the frequency of each state using the same color code as in 2D. Red dashed line depicts position of the TSSs. The percentages of molecules harboring footprints for the engaged Pol II are indicated on the right side of the plot. (D) Inhibition of transcription initiation leads to a genome-wide reduction of engaged polymerases and an increase of the frequency of PIC and unbound states. Shown is a heatmap displaying the promoters showing the highest differences in state abundance (n = 468) after a 10-min inhibition of initiation (Triptolide). Left side bar depicts presence (green) or absence (black) of a TATA box at promoters. Promoters were organized by k-means clustering. (E) Loss of Pol II at paused promoters upon inhibiting initiation is of similar amplitude than at non-paused promoters. Plotted is the starting amount of engaged Pol II at non-paused against the amount of Pol II lost after 10 min of initiation inhibition for two promoter categories (non-paused genes, black dots; paused genes, red dots). The running median for each starting Pol II amount is depicted for each category (non-paused genes, black; paused genes, red thick line). (F) A similar fraction of Pol-II-bound molecules is lost at paused and non-paused promoters. Distribution of the fold change in Pol-II-bound amounts (log2) for both promoter categories (non-paused, black; paused, red) illustrating that all promoters loose a comparable fraction (∼65%) of Pol II irrespective of their category or the amount of Pol II before Triptolide treatment.
Figure 5
Figure 5
High Levels of Pol II Turnover at Paused Promoters (A) Inhibition of transcription initiation leads to a rapid reduction of engaged polymerases at promoters also at paused genes. Heatmap depicting the changes in absolute levels of engaged Pol II after different time of inhibition of transcription initiation (time as indicated). Left side bar depicts the promoter category (non-paused, black; paused, red). Left bar plot depicts the amount of GRO-seq signal in gene body (dark gray) relative to promoter (light gray). Promoters were organized by hierarchical clustering. (B and C) Single-locus examples of the effect of inhibition of transcription initiation at the (B) CG8180 paused promoter and the (C) ps non-paused promoter. Shown are average methylation levels before and after inhibition (top panel, black dots [untreated] and red dots [initiation inhibition] connected by a line). The single-molecule stacks for untreated (left panel) and incubated 10 min with initiation inhibitor (right panel) display footprints measured by targeted amplicon bisulfite sequencing, sorted into five states using the classification algorithm (methylated Cs, accessible, light gray; unmethylated Cs, protected, black). The vertical side bar depicts the frequency of each state using the same color code as Figure 2D. Red dashed line depicts position of the TSSs. The percentages of molecules harboring footprints for engaged Pol II are indicated on the right side of the plot. (D) Examples of promoters that display different elongation rates yet comparable decay kinetics of engaged Pol II after inhibition of initiation. Bar plot depicting the amount of GRO-seq signal in gene body (dark gray) relative to promoter (light gray) for each example. Time-course data are displayed for the paused Hsp70 promoter versus the non-paused glec promoter and the CG8180 paused promoter versus the non-paused ps promoter. Blue dots represent the relative amount of engaged Pol II lost at each time point relative to the starting amount (two independent biological measurements are plotted for each time point). Blue line depicts average of replicates. Note the rapid loss at both the glec and Hsp70 promoter already at the first measurement point 2.5 min following inhibition. (E) scRNAs decay with similar kinetics as Pol II footprints after inhibition of initiation. Relative scRNA abundance over a time course of inhibition at the same set of TSSs. Blue dots represent the amount of scRNA at each time point relative to the starting amount (two independent biological measurements are plotted for each time point). Blue line depicts the average signal. (F) Inhibition of initiation leads to a global reduction of scRNA levels with various kinetics genome-wide. Heatmap depicting the relative changes in scRNA abundance after Triptolide inhibition at a highly active promoters (top 10%, Pol II ChIP-seq). The heatmap was organized using k-means clustering into six different clusters (right side bar). Left side bar depicts the promoter category (non-paused, black; paused, red). Shown are average values over two biological replicates. (G) scRNA decay kinetics for each group of TSS (color as in A). Shown is the distribution of scRNA levels for each TSS (black dots) and the median abundance at each time point (colored lines and dots). The first time point where the median of the relative scRNA amount reached 50% of its original value was used to approximate the half-life for each cluster.
Figure 6
Figure 6
Heat Shock Response Requires Continuous Transcriptional Initiation (A) Effect of short inhibition of initiation or elongation on heat shock response. Heatmap displays the redistribution of states upon various treatments (left panel) (HS, heat shock 1 min; Trp, Triptolide 2.5 min, initiation block; Fl, Flavopiridol 2.5 min, elongation block). (B) Bar graph displaying the relative expression change with the same treatments as measured by qRT-PCR (fold change calculated using the comparative Ct method). Error bars represent SD from three biological replicates. (C–E) Heat shock induction does not affect frequencies of early transcription intermediates. Examples of Hsp70 promoter footprints before (C) and after heat-shock (D) or after Triptolide inhibition (E). Shown are average footprinting levels (top panel) (black dots and line) and single-molecule stacks measured by targeted amplicon bisulfite sequencing, sorted into five states using the classification algorithm. The vertical side bar depicts the frequency of each state using the same color code as 2D. The percentages of molecules harboring footprints for engaged Pol II are indicated on the right side of the plot.

Similar articles

Cited by

References

    1. Arnold C.D., Gerlach D., Stelzer C., Boryń Ł.M., Rath M., Stark A. Genome-wide quantitative enhancer activity maps identified by STARR-seq. Science. 2013;339:1074–1077. - PubMed
    1. Bell O., Schwaiger M., Oakeley E.J., Lienert F., Beisel C., Stadler M.B., Schübeler D. Accessibility of the Drosophila genome discriminates PcG repression, H4K16 acetylation and replication timing. Nat. Struct. Mol. Biol. 2010;17:894–900. - PubMed
    1. Brannan K., Kim H., Erickson B., Glover-Cutter K., Kim S., Fong N., Kiemele L., Hansen K., Davis R., Lykke-Andersen J., Bentley D.L. mRNA decapping factors and the exonuclease Xrn2 function in widespread premature termination of RNA polymerase II transcription. Mol. Cell. 2012;46:311–324. - PMC - PubMed
    1. Buckley M.S., Kwak H., Zipfel W.R., Lis J.T. Kinetics of promoter Pol II on Hsp70 reveal stable pausing and key insights into its regulation. Genes Dev. 2014;28:14–19. - PMC - PubMed
    1. Cianfrocco M.A., Kassavetis G.A., Grob P., Fang J., Juven-Gershon T., Kadonaga J.T., Nogales E. Human TFIID binds to core promoter DNA in a reorganized structural state. Cell. 2013;152:120–131. - PMC - PubMed

MeSH terms