. 2017 Sep 15;595(18):6121-6145.
doi: 10.1113/JP274164. Epub 2017 Aug 14.

Post-translational palmitoylation controls the voltage gating and lipid raft association of the CALHM1 channel

Affiliations

Post-translational palmitoylation controls the voltage gating and lipid raft association of the CALHM1 channel

Akiyuki Taruno et al. J Physiol. .

Abstract

Key points: Calcium homeostasis modulator 1 (CALHM1), a new voltage-gated ATP- and Ca2+ -permeable channel, plays important physiological roles in taste perception and memory formation. Regulatory mechanisms of CALHM1 remain unexplored, although the biophysical disparity between CALHM1 gating in vivo and in vitro suggests that there are undiscovered regulatory mechanisms. Here we report that CALHM1 gating and association with lipid microdomains are post-translationally regulated through the process of protein S-palmitoylation, a reversible attachment of palmitate to cysteine residues. Our data also establish cysteine residues and enzymes responsible for CALHM1 palmitoylation. CALHM1 regulation by palmitoylation provides new mechanistic insights into fine-tuning of CALHM1 gating in vivo and suggests a potential layer of regulation in taste and memory.

Abstract: Emerging roles of CALHM1, a recently discovered voltage-gated ion channel, include purinergic neurotransmission of tastes in taste buds and memory formation in the brain, highlighting its physiological importance. However, the regulatory mechanisms of the CALHM1 channel remain entirely unexplored, hindering full understanding of its contribution in vivo. The different gating properties of CALHM1 in vivo and in vitro suggest undiscovered regulatory mechanisms. Here, in searching for post-translational regulatory mechanisms, we discovered the regulation of CALHM1 gating and association with lipid microdomains via protein S-palmitoylation, the only reversible lipid modification of proteins on cysteine residues. CALHM1 is palmitoylated at two intracellular cysteines located in the juxtamembrane regions of the third and fourth transmembrane domains. Enzymes that catalyse CALHM1 palmitoylation were identified by screening 23 members of the DHHC protein acyltransferase family. Epitope tagging of endogenous CALHM1 proteins in mice revealed that CALHM1 is basally palmitoylated in taste buds in vivo. Functionally, palmitoylation downregulates CALHM1 without effects on its synthesis, degradation and cell surface expression. Mutation of the palmitoylation sites has a profound impact on CALHM1 gating, shifting the conductance-voltage relationship to more negative voltages and accelerating the activation kinetics. The same mutation also reduces CALHM1 association with detergent-resistant membranes. Our results comprehensively uncover a post-translational regulation of the voltage-dependent gating of CALHM1 by palmitoylation.

Keywords: ion channel; palmitoylation; taste.


Figures

Figure 1
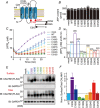
Figure 1. Intracellular and transmembrane Cys regulate function and cell surface expression of CALHM1
A, schematic diagram of the putative membrane topology of a CALHM1 monomer, identifying Cys in the intracellular and TM domains. The palmitoylated Cys are indicated in red. TM, transmembrane domain; C, Cys. B, total cellular ATP content of HeLa cells transfected with the empty vector (mock), WT CALHM1, or single CS mutant. C, time courses of [ATP]o due to release from HeLa cells expressing WT or single CS mutant CALHM1 as well as mock‐transfected cells following exposure to zero (∼17 nm) [Ca2+]o. Untagged CALHM1 constructs were expressed in B and C. D, summary of [ATP]o at 20 min in C. Number of experiments in parentheses. E, representative Western blots of the surface biotinylation analysis of WT and single CS mutant CALHM1 in N2a cells. Biotinylated proteins (Surface) were avidin affinity‐purified from the whole cell lysates (Total) and analysed by Western blotting. Carboxyl‐terminally FLAG tagged CALHM1 (CALHM1‐FLAG) constructs were expressed and detected by anti‐FLAG antibody for biochemistry throughout and glyceraldehyde‐3‐phosphate dehydrogenase (GAPDH) was detected as a loading control. F, summary of the ratios of surface‐to‐total CALHM1 levels normalized to WT. n = 3.
Figure 2
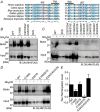
Figure 2. CALHM1 is post‐translationally modified by protein S‐palmitoylation
A, detection of S‐acylation on CALHM1, CALHM2 or CALHM3 by the ABE assay in N2a cells. The difference in the amount of biotinylated proteins (Biotin) between Tris‐treated (NH2OH ‘−’) and hydroxylamine‐treated (NH2OH ‘+’) samples (Input) quantitatively indicates the existence of S‐acylation. FLAG‐tagged CALHM proteins were expressed and detected by anti‐FLAG antibody. B, detection of CALHM1 S‐acylation in HeLa cells by the ABE assay. C, detection of CALHM1 S‐acylation in Xenopus oocytes by the ABE assay. Oocytes injected with water or CALHM1‐FLAG cRNA were analysed. D, detection of incorporation of 17‐ODYA into CALHM1 through a hydroxylamine‐cleavable linkage by metabolic labelling. E, effects of 2BP (100 μm, 16 h) on CALHM1 palmitoylation demonstrated by the ABE assay.
Figure 3
Figure 3. Identification of palmitoylation sites on CALHM1
A, alignment of primary sequences surrounding C100 and C207 for different species. *represents a fully conserved residue, and ‘:’ and ‘.’ indicate strong and weak similarities, respectively. The putative TM3 and TM4 are indicated. Amino acid numbering is based on the murine CALHM1. B–D, representative Western blots of the ABE assay for WT, C100S, C207/234/245/312S and C100/207/234/245/312S (5CS) CALHM1 (B), for WT, 5CS, C207/234/245/312S, C100/234/245/312S, C100/207/245/312S, C100/207/234/312S and C100/207/234/245S CALHM1 (C), and for WT, C100S, C207S, C100/207S and C234/245/312S CALHM1 (D). E, quantitative summary of palmitoylation levels of WT and mutant CALHM1 in D. Levels of palmitoylation were calculated by comparison of biotinylated CALHM1 levels in corresponding samples with and without NH2OH treatment after normalization to the input levels and were normalized with respect to WT. n = 3. * P < 0.05 (Tukey's HSD test).
Figure 4
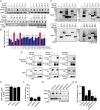
Figure 4. Screening for CALHM1 palmitoylating enzymes
A, screening of 23 DHHC enzymes for their ability to enhance CALHM1 palmitoylation. Shown are representative Western blots of the ABE assay for CALHM1. CALHM1‐FLAG cDNA was co‐transfected with either one of 23 DHHC‐HA cDNAs. GST‐HA cDNA was used as mock transfection in place of DHHCs. DHHC clone numbers are shown in both the old (DHHC) and new (zDHHC) nomenclatures. B, quantitative summary of levels of CALHM1 palmitoylation in A. n = 3. C, expression of DHHC proteins in samples analysed in A. HA‐tagged DHHC proteins were detected by anti‐HA antibody. D, interaction between CALHM1 and DHHC3, 7 and 20, demonstrated by co‐immunoprecipitation. CALHM1‐FLAG and DHHC‐HA were expressed as indicated and respectively detected with anti‐FLAG and ‐HA antibodies in whole cell lysates (Input) and eluates after pulldown with anti‐FLAG antibody (Pulldown). ‘+’, cDNA transfected; ‘−’, mock transfection. E, mRNA expression of Dhhc3, 7 and 20 in N2a cells. The mRNA level of each gene quantified by qRT‐PCR is expressed as a fraction of that of Actb. n = 4. F, efficiency of siRNA‐mediated knockdown of Dhhc3, 7 and 20. For each Dhhc, the mRNA expression remaining after its knockdown is expressed as a percentage of its mRNA level in control cells. n = 3. G, effect of knockdown of Dhhc3, 7 and 20 on CALHM1 palmitoylation in N2a cells demonstrated by the ABE assay. H, quantitative summary of palmitoylation levels of CALHM1 in G. n = 3. * P < 0.05 (Tukey's HSD test).
Figure 5
Figure 5. CALHM1 is palmitoylated in taste cells in vivo
A, strategy for the generation of a Calhm1V5‐ires‐Cre KI allele. Black boxes, exons 1 and 2 of Calhm1; 5′ arm and 3′ arm, homologous arms of the plasmid donor; arrows, PCR primers (Cal1‐F, Cal1‐R and V5‐R) for RT‐PCR. B, genome sequencing across the 5′ and 3′ boundaries of the targeting region confirmed correct fusion of a V5 tag to the last codon of Calhm1 and insertion of the full length transgene sequence. C, RT‐PCR of mRNA of CALHM1‐V5 (mutant transcript), CALHM1, CALHM2, CALHM3 and Actb from the brain and the tongue in wild type (Calhm1+/+) and heterozygous Calhm1 KI (Calhm1V5‐ires‐Cre/+) mice. RT(−), no reverse transcriptase control. Primer sequences and PCR conditions are shown in Table 1. D, immunohistochemical detection of Cre in taste buds of Calhm1V5‐ires‐Cre/+ mice. Cre (green) and Skn‐1a (red) were fluorescently double‐labelled in 10 μm‐thick tissue sections containing the circumvallate papillae of Calhm1+/+ and Calhm1V5‐ires‐Cre/+ mice. Sections were counterstained with DAPI. Scale bars, 10 μm. E, Western blot detection of CALHM1‐V5 in taste buds of Calhm1V5‐ires‐Cre/+ mice. Lysates (95 μg) from lingual epithelial sheets bearing taste buds (TB) and non‐gustatory lingual epithelial sheets devoid of taste buds (LE) collected from Calhm1+/+ and Calhm1V5‐ires‐Cre/+ mice (4 mice/sample) were analysed by Western blotting with lysates (1 μg) of N2a cells expressing CALHM1‐V5 and control N2a cells as positive and negative controls, respectively. A band for V5 at the size corresponding to CALHM1‐V5 (*) was observed only in TB of Calhm1V5‐ires‐Cre/+ mice. F, palmitoylation of CALHM1 in taste buds in vivo demonstrated by the ABE assay. Lingual epithelial sheets containing circumvallate and foliate papillae were collected from 10 Calhm1+/V5‐ires‐Cre KI mice and subjected to the ABE assay. Replacing hydroxylamine (NH2OH) with a Tris‐buffer (NH2OH ‘−’) served as a negative control to prove efficient initial blockade of free Cys thiols.
Figure 6
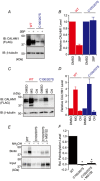
Figure 6. Palmitoylation does not control CALHM1 protein degradation
A, Western blot analysis of WT and C100/207S CALHM1. N2a cells were transfected with WT or C100/207S CALHM1‐FLAG and treated with 100 μm 2BP or vehicle (0.1% DMSO) for 8 h before being harvested at 24 h post‐transfection. β‐Tubulin signal was used as a loading control. B, quantitative summary of CALHM1 expression levels in A. For each of WT and C100/207S CALHM1, CALHM1 levels after normalization to the β‐tubulin levels were further normalized with respect to vehicle‐treated samples to highlight the effects of 2BP. n = 3. C, effects of 20 μm MG‐132 (MG) and 50 μm chloroquine (Chl) on expression levels of WT and C100/207S CALHM1. N2a cells transfected with WT or C100/207S CALHM1‐FLAG were treated with either one of the drugs for 8 h before being harvested at 24 h post‐transfection. D, quantitative summary of WT and C100/207S CALHM1 expression levels in C calculated as in B. n = 3. E, representative Western blots of the ABE assay for WT and C100/207S CALHM1, where N2a cells transfected with WT or C100/207S CALHM1‐FLAG were treated with 20 μm MG‐132 or vehicle for 8 h before being harvested at 24 h post‐transfection. F, quantitative summary of CALHM1 palmitoylation levels in E. n = 3. * P < 0.05 (Tukey's HSD test).
Figure 7
Figure 7. Palmitoylation downregulates CALHM1 function
A, phase‐contrast (top) and GFP fluorescence (bottom) images of live N2a cells transfected with WT (left) or C100/207S (right) CALHM1 cloned in pIRES2.AcGFP1. B, cell viabilities of WT and C100/207S CALHM1‐transfected N2a cells 24 h after transfection normalized with respect to mock. Treatment with 0.1% Triton X‐100 was used as control. * P < 0.05 (Tukey's HSD test). C, effect of 2BP on cytotoxicity of WT and C100/207S CALHM1. Cell viabilities of HeLa cells 24 h after transfection with WT and C100/207S CALHM1 normalized to mock were measured with or without 2BP treatment. * P < 0.05 (Student's t test). D, cell viabilities of HeLa cells compared to mock 6 and 24 h after transfection with WT and C100/207S CALHM1‐FLAG. * P < 0.05 (Tukey's HSD test). E, a representative Western blot for analysis of WT and C100/207S CALHM1 expression 6 h after transfection. HeLa cells transfected with WT or C100/207S CALHM1‐FLAG were harvested at 6 h post‐transfection. β‐tubulin signal was used as a loading control. Shown below is quantitative summary of WT and C100/207S CALHM1 expression. WT and C100/207S CALHM1 levels after normalization to the respective β‐tubulin levels were further normalized with respect to WT. n = 7. NS, not significant (Student's t test). F and G, total cellular ATP content (F) and time courses of [ATP]o following removal of Ca o2+ (G) in HeLa cells 6 h after transfection with mock, WT or C100/207S CALHM1‐FLAG. H, summary of [ATP]o at 30 min in G. * P < 0.05 (Tukey's HSD test). I, a representative Western blot for analysis of WT and C100/207S CALHM1 expression 9 h after transfection. Quantitative summary is shown below. n = 6. * P < 0.05 (Student's t test). J and K, total cellular ATP content (J) and time courses of [ATP]o following Ca o2+ removal (K) in HeLa cells 9 h after transfection with mock, WT or C100/207S CALHM1‐FLAG, and/or DHHC3‐HA as indicated. L, summary of [ATP]o at 30 min in K. * P < 0.05 (Student's t test).
Figure 8
Figure 8. Palmitoylation downregulates CALHM1 association with DRMs
A, immunofluorescence images of N2a cells expressing WT (top) or C100/207S (bottom) CALHM1‐FLAG. Cells were treated with 100 μg mg−1 cycloheximide (CHX, right) or vehicle (left) for 90 min before being fixed at 8 h post‐transfection. CALHM1‐FLAG proteins were fluorescently labelled with anti‐FLAG antibody. Labelling of CALHM1‐FLAG and DAPI is green and blue, respectively. Confocal 2‐colour merged images taken at ×40 magnification are displayed. Scale bars, 10 μm. B, representative Western blots of the surface biotinylation analysis of WT and C100/207S CALHM1. Biotinylated proteins (Surface) were avidin affinity‐purified from the whole cell lysates (Total) and analysed by Western blotting. C, summary of the ratios of surface‐to‐total CALHM1 levels normalized to WT. n = 4. D, representative Western blots detecting WT and C100/207S CALHM1 in DS and DRM fractions. Flotillin 1 is a DRM marker protein. DS, detergent‐soluble fraction; DRM, detergent‐resistant membrane fraction. E, localization of WT and C100/207S CALHM1 in DRM fraction normalized with respect to WT. n = 4. NS, not significant; * P < 0.05 (Student's t test). F, filipin staining of cholesterol in HeLa cells. Cells were treated with or without 2 mm methyl‐β‐cyclodextrin (MbCD) in the normal bath solution for 2 h at 37°C followed by incubation without MbCD for 1 h at 37°C before being fixed and stained with filipin. G and H, total ATP content (G) and time courses of [ATP]o following removal of Ca o2+ (H) in HeLa cells expressing WT CALHM1 after MbCD treatment as in F. I, filipin staining of cholesterol in HeLa cells. Cells were cultured in medium with or without 2 mm MbCD for 16 h before being subjected to filipin staining. Note that, after MbCD treatment, signals in the plasma membrane are markedly reduced whereas intracellular signals are relatively maintained. J, effect of MbCD on cytotoxicity of WT CALHM1. Cell viabilities of HeLa cells 24 h after transfection with mock or WT CALHM1 were measured with or without MbCD treatment (2 mm, 16 h) as in I. Viability of mock‐transfected cells without MbCD treatment were considered as 100%.
Figure 9
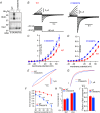
Figure 9. Palmitoylation controls voltage sensitivity and activation kinetics of CALHM1
A, representative Western blots of the ABE assay showing the presence and absence of palmitoylation in WT and C100/207S CALHM1 expressed in Xenopus oocytes, respectively. B, macroscopic currents observed in oocytes expressing WT (left) or C100/207S (right) CALHM1 in the bath solution containing 1.8 mm Ca2+ and 1 mm Mg2+ in response to 5 s voltage pulses ranging from −40 to +70 mV with a holding potential of −80 mV. The pulse protocol is shown at the bottom. C, current–voltage relationships for WT and C100/207S CALHM1 derived from the current amplitudes measured at the end of the depolarizing pulses. D, normalized G–V relationships for WT and C100/207S CALHM1 derived from the maximum tail currents measured at −80 mV after a series of voltage pulses by fitting the current magnitude with a two‐state Boltzmann function (lines). WT, V 1/2 = 67 ± 3 mV, z = 1.7 ± 0.1; C100/207S, V 1/2 = 48 ± 2 mV, z = 1.5 ± 0.1. E, normalized traces showing the current activation phase for WT and C100/207S at +70 mV. F, the time required to reach half the current amplitude recorded at the end of depolarization pulses (5 s) plotted against pulse voltages. G, normalized traces showing the current deactivation phase for WT and C100/207S CALHM1 at −80 mV. H, time constants for fast and slow exponential components of the deactivation phase calculated at −80 mV. I, fraction of the fast component in the deactivation phase at −80 mV. n = 13 (WT) and 11 (C100/207S). *** P < 0.001 vs. WT (Student's t test).

Similar articles

Cited by

References

    1. Abrami L, Kunz B, Iacovache I & van der Goot FG (2008). Palmitoylation and ubiquitination regulate exit of the Wnt signaling protein LRP6 from the endoplasmic reticulum. Proc Natl Acad Sci USA 105, 5384–5389. - PMC - PubMed
    1. Abrami L, Leppla SH & van der Goot FG (2006). Receptor palmitoylation and ubiquitination regulate anthrax toxin endocytosis. J Cell Biol 172, 309–320. - PMC - PubMed
    1. Bischoff R & Schluter H (2012). Amino acids: chemistry, functionality and selected non‐enzymatic post‐translational modifications. J Proteomics 75, 2275–2296. - PubMed
    1. Bosmans F, Milescu M & Swartz KJ (2011). Palmitoylation influences the function and pharmacology of sodium channels. Proc Natl Acad Sci USA 108, 20213–20218. - PMC - PubMed
    1. Chamberlain LH & Shipston MJ (2015). The physiology of protein S‐acylation. Physiol Rev 95, 341–376. - PMC - PubMed

Publication types

LinkOut - more resources