. 2017 Jul 21;7(1):6162.
doi: 10.1038/s41598-017-05472-0.

A gene network regulated by FGF signalling during ear development

Affiliations

A gene network regulated by FGF signalling during ear development

Maryam Anwar et al. Sci Rep. .

Abstract

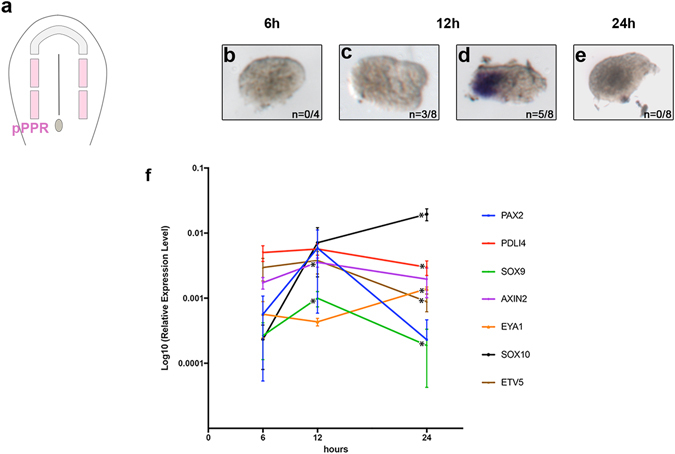
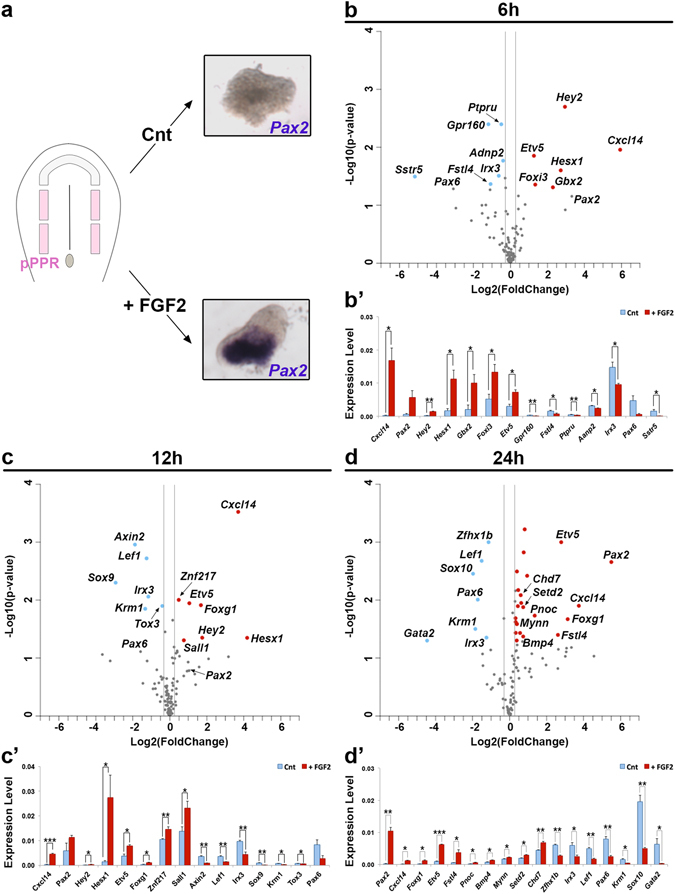
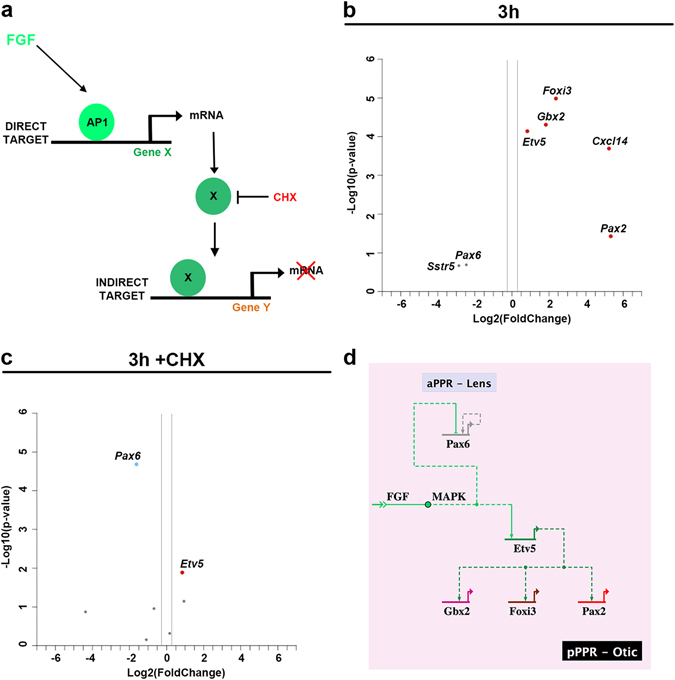
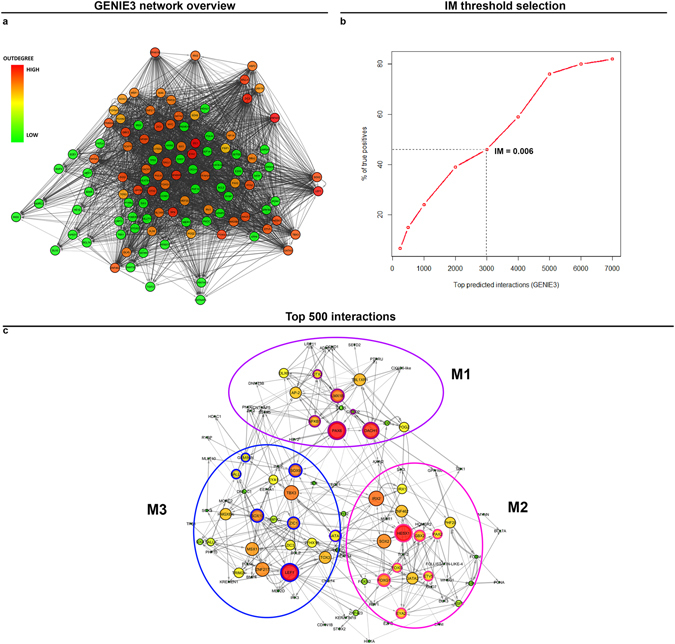
During development cell commitment is regulated by inductive signals that are tightly controlled in time and space. In response, cells activate specific programmes, but the transcriptional circuits that maintain cell identity in a changing signalling environment are often poorly understood. Specification of inner ear progenitors is initiated by FGF signalling. Here, we establish the genetic hierarchy downstream of FGF by systematic analysis of many ear factors combined with a network inference approach. We show that FGF rapidly activates a small circuit of transcription factors forming positive feedback loops to stabilise otic progenitor identity. Our predictive network suggests that subsequently, transcriptional repressors ensure the transition of progenitors to mature otic cells, while simultaneously repressing alternative fates. Thus, we reveal the regulatory logic that initiates ear formation and highlight the hierarchical organisation of the otic gene network.


Conflict of interest statement

The authors declare that they have no competing interests.

Figures

Figure 1
Figure 1
Transient expression of otic markers. Cultured pPPR ectoderm (pink) (a) was assessed for Pax2 expression (be); 62% of the explants are Pax2 + after 12 hours’ culture (c,d). NanoString analysis shows a few other otic genes with a similar profile, while Sox10 and Eya1 increase at 24 hrs (f). Error bars in f represent the standard error; asterisk: statistically significant change.
Figure 2
Figure 2
FGF2-regulated transcripts. When cultured in isolation pPPR explants do not express Pax2 after 24 hrs, while addition of FGF2 induces Pax2 (a). Changes in gene expression after 6, 12 and 24 hrs FGF-treatment was assessed by NanoString; results are plotted using Log2 transformed fold change (+FGF2/Control) (x-axis) and −Log10 (p-value) (y-axis) (bd). A fold change of 1.5 or 0.25 (grey lines) and a p-value < 0.05 were used as threshold; transcripts not passing these thresholds are shown in grey and significantly up- and downregulated genes are shown in red and blue, respectively. (b’d’) Bar charts showing transcripts with significant changes; controls in blue and FGF2-treated in red. Error bars represent the standard error. Asterisks (***, ** and *) indicate significant differences (0.001, 0.01 and 0.05, respectively).
Figure 3
Figure 3
Direct FGF targets. FGF signaling directly regulates gene expression (Gene X) via AP1 (Jun/Fos complex), thereafter Gene X may activate indirect targets (Gene Y). Addition of the protein synthesis blocker cycloheximide (CHX) allows the identification direct FGF targets (a). After 3 hrs culture, gene expression in control and FGF treated pPPR explants was quantified by RT-qPCR (b). Explants were treated with CHX, in the presence or absence of FGF, and gene expression was analyzed RT-qPCR (c). Genes significantly up- and downregulated (≥1.5 or ≤0.25-fold change) are indicated in red and blue, respectively (p-value < 0.05). Etv5 and Pax6 are the only direct targets. (d) Simple network showing gene activation/repression downstream of FGF.
Figure 4
Figure 4
Requirement of FGF signalling for mesoderm induced otic genes. 0 ss pPPR ectoderm (pink) was dissected together with the underlying mesoderm (green), the endogenous source of FGF. Inhibition of FGF signalling by SU5402 inhibits Pax2 expression (a). Changes in gene expression was assessed after 6, 12 and 24 hrs by NanoString. Log2 transformed fold change (SU5402/DMSO) are plotted against –Log10 (p-value) (bd). A 1.5 and 0.25-fold change was used as threshold (grey lines); transcripts not passing these thresholds are shown as grey dots. Significantly up- and down-regulated genes are shown in red and blue, respectively (p- value < 0.05). (b’d’) Bar chart showing transcripts with significant changes; controls in red and SU5402-treated in blue. Error bars represent the standard error. Asterisks (***, ** and *) indicate significant differences (0.001, 0.01 and 0.05, respectively).
Figure 5
Figure 5
Network inference using GENIE3 reveals different modules. Using GENIE3, a directed network of interactions was predicted among the genes in NanoString data. Cytoscape view of the network where nodes are coloured according to their out-degrees (interactions emerging from each node); higher out-degrees are colour-coded in red and low out-degrees in green (a). To analyze accuracy of predictions, the percentage of true positives (known interactions from literature) retrieved by GENIE3 were plotted against the total number of predictions at various IM thresholds; a cut-off of IM >= 0.006 was selected (b). Analysis of top 500 predicted interactions above the threshold reveals three modules (c): M1 corresponds to FGF-repressed genes (anterior genes: nodes encircled in purple), M2 corresponds to genes initiated by FGF rapidly (nodes encircled in pink) and M3 to late FGF-response genes (nodes encircled in blue).
Figure 6
Figure 6
Community clustering of the top 500 GENIE3 predicted interactions identifies sub-networks in response to FGF. Clustering of the top 500 interactions in the predicted NanoString network using Newman’s community clustering (GLay Plugin in Cytoscape) confirms network modularity reveals 5 clusters (Clusters NC4 and NC5 are shown in Fig. S3). Each cluster was mapped to enriched GO and KEGG terms (P-value < 0.05) and nodes coloured accordingly (a). Genes that do not map to any terms are coloured white. Repressive (pink) and activating interactions were determined from the Pearson’s correlation coefficient values between the NanoString genes. Edges are weighted according to IM values. Cluster NC1 includes anterior genes that respond negatively to FGF with some corresponding GO terms including eye development and anterior/posterior pattern formation. Cluster NC2 corresponds to OEP and otic genes that respond positively to FGF with corresponding terms including inner ear development and sensory perception of sound. Cluster NC3 contains genes that respond to FGF later. Pearson’s correlation coefficient was calculated between all pairs of genes in the NanoString data and plotted as a heatmap (b). Clusters NC1-3 are highlighted as purple, pink and blue boxes in the heatmap. The colour key on the right indicates the correlation coefficient with dark blue corresponding to 1 and dark red to −1. Dot sizes in the heatmap correspond to the strength of correlation with 1 and −1 having the largest size.
Figure 7
Figure 7
Network inference reveals a small FGF-activated circuit of positive feed-back loops. (a) Using published data (see Supplementary Table 1) a network of FGF-response genes during early OEP induction was generated using BioTapestry. Positive interactions are shown as arrows and repressive interactions as horizontal bars. Diagram of an embryo at OEP stage (a’, top) with the section (a’, bottom) showing the mesoderm as FGF source. (b) Network incorporating our data showing that Etv5 and Pax6 are direct FGF targets (see Fig. 3), as well as predicted interactions by GENIE3 network inference and first neighbour analysis (see Fig. S4). This reveals a small circuit of positive feed-back loops involving key OEP genes (b’). See text for details.
Figure 8
Figure 8
Network inference predicts inhibitory circuits to stabilise otic fate. (a) Misexpression (ME) of Hesx1 (2/5), but not of GFP (6/6) leads to loss of Foxi3 expression in OEPs (a, a’- a””; blue) Note: normal Foxi3 expression is very dynamic and changes rapidly; control embryo is at 10 ss and experimental embryo at 8 ss. (b,c) Hesx1 ME results in a reduction of Etv5 (b, b’, b”; blue, 2/11) and Eya2 (c, c’, c”; blue, 2/10) in OEPs, while controls do not show any loss (Etv5: 10/10; Eya2: 9/9). (d) Misexpression of Foxg1 (3/15), but not of GFP (11/11) in the anterior head region causes a reduction of Six3 in the anterior PPR. For each marker, the two panels on the left are controls (Cnt) and those on the right represent Hesx1 or Foxg1 misexpression before (left) and after GFP immunostaining (right; brown) to visualise targeted cells. Panels below show sections through the same embryos; a’-d’, a’”-d’” low magnification; a”-d”, a””-d”” high magnification of the electroporated area. At 10 ss, otic (O) and epibranchial (Epi) fates have segregated (e) and new genes are activated downstream of FGF signalling among them the transcriptional repressors Hesx1, Sall1, Znf217 and Foxg1. BioTapestry network incorporating the FGF time course data (Fig. 2), network predictions and first neighbour analysis (Fig. S4) and functional data (f). Hesx1 represses posterior PPR genes and the FGF mediator Etv5 (g) while Foxg1 inhibits the anterior PPR gene Six3 and is predicted to repress other anterior and non-neural ectoderm transcripts (h). Sall1 is predicted to regulate Sox10, Six4 and Znf217 negatively (i). See text for details.

Similar articles

Cited by

References

    1. Chen J, Streit A. Induction of the inner ear: stepwise specification of otic fate from multipotent progenitors. Hearing Research. 2013;297:3–12. doi: 10.1016/j.heares.2012.11.018. - DOI - PubMed
    1. Sai X, Ladher RK. Early steps in inner ear development: induction and morphogenesis of the otic placode. Front Pharmacol. 2015;6:19. doi: 10.3389/fphar.2015.00019. - DOI - PMC - PubMed
    1. Bhattacharyya S, Bailey AP, Bronner-Fraser M, Streit A. Segregation of lens and olfactory precursors from a common territory: cell sorting and reciprocity of Dlx5 and Pax6 expression. Developmental Biology. 2004;271:403–414. doi: 10.1016/j.ydbio.2004.04.010. - DOI - PubMed
    1. Kozlowski DJ, Murakami T, Ho RK, Weinberg ES. Regional cell movement and tissue patterning in the zebrafish embryo revealed by fate mapping with caged fluorescein. Biochemistry and Cell Biology. 1997;75:551–562. doi: 10.1139/o97-090. - DOI - PubMed
    1. Pieper M, Eagleson GW, Wosniok W, Schlosser G. Origin and segregation of cranial placodes in Xenopus laevis. Developmental Biology. 2011;360:257–275. doi: 10.1016/j.ydbio.2011.09.024. - DOI - PubMed

Publication types

MeSH terms

Substances

LinkOut - more resources