. 2017 Sep 19;136(12):1123-1139.
doi: 10.1161/CIRCULATIONAHA.117.028252. Epub 2017 Jul 21.

Multicellular Transcriptional Analysis of Mammalian Heart Regeneration

Affiliations

Multicellular Transcriptional Analysis of Mammalian Heart Regeneration

Gregory A Quaife-Ryan et al. Circulation. .

Abstract

Background: The inability of the adult mammalian heart to regenerate following injury represents a major barrier in cardiovascular medicine. In contrast, the neonatal mammalian heart retains a transient capacity for regeneration, which is lost shortly after birth. Defining the molecular mechanisms that govern regenerative capacity in the neonatal period remains a central goal in cardiac biology. Here, we assemble a transcriptomic framework of multiple cardiac cell populations during postnatal development and following injury, which enables comparative analyses of the regenerative (neonatal) versus nonregenerative (adult) state for the first time.

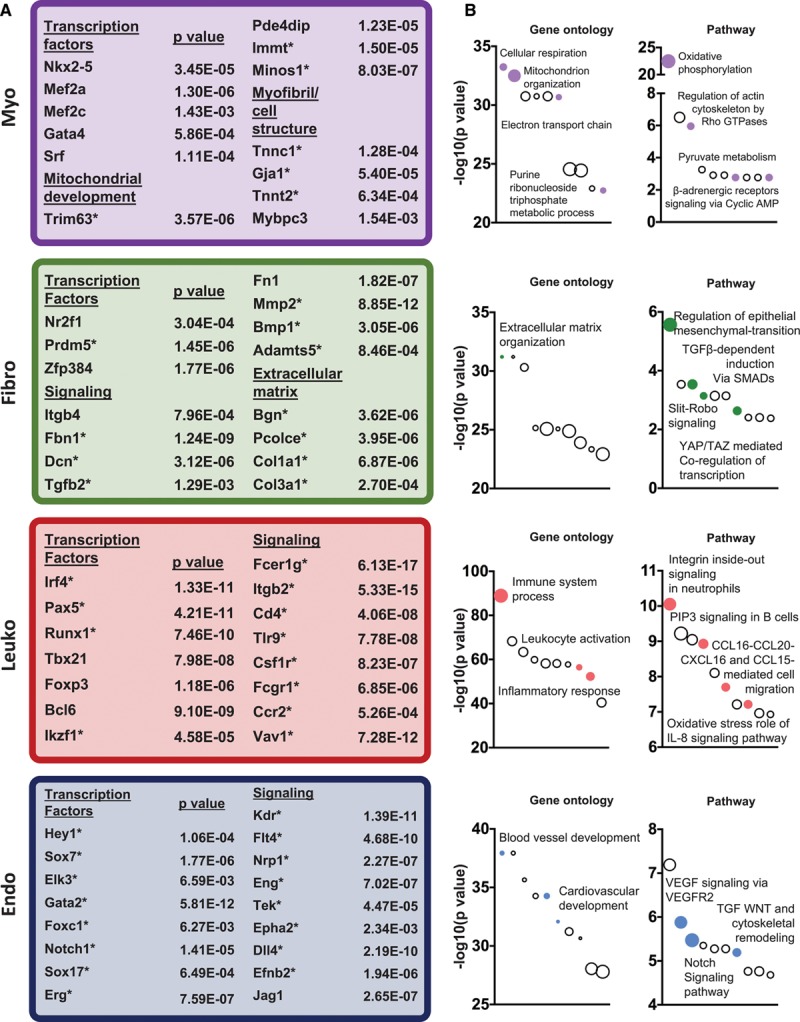
Methods: Cardiomyocytes, fibroblasts, leukocytes, and endothelial cells from infarcted and noninfarcted neonatal (P1) and adult (P56) mouse hearts were isolated by enzymatic dissociation and fluorescence-activated cell sorting at day 3 following surgery. RNA sequencing was performed on these cell populations to generate the transcriptome of the major cardiac cell populations during cardiac development, repair, and regeneration. To complement our transcriptomic data, we also surveyed the epigenetic landscape of cardiomyocytes during postnatal maturation by performing deep sequencing of accessible chromatin regions by using the Assay for Transposase-Accessible Chromatin from purified mouse cardiomyocyte nuclei (P1, P14, and P56).

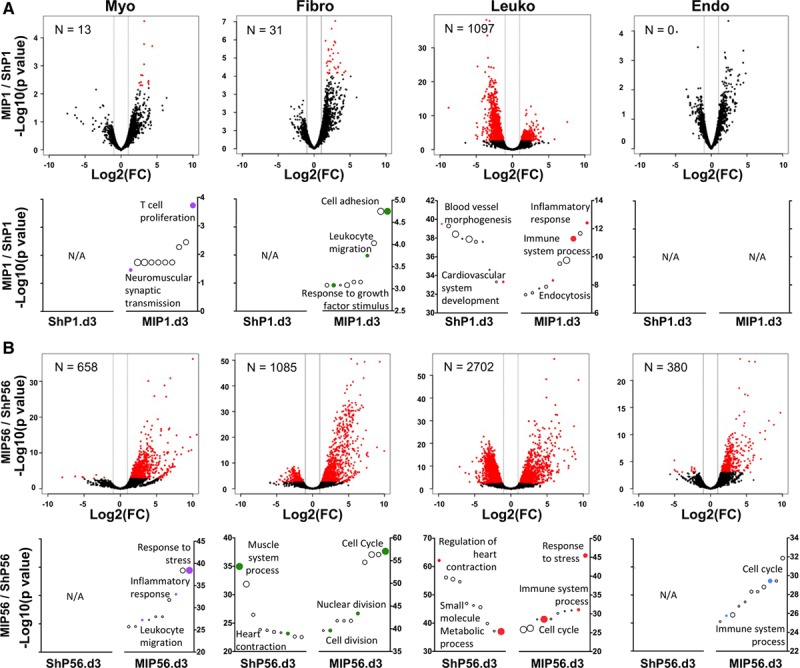
Results: Profiling of cardiomyocyte and nonmyocyte transcriptional programs uncovered several injury-responsive genes across regenerative and nonregenerative time points. However, the majority of transcriptional changes in all cardiac cell types resulted from developmental maturation from neonatal stages to adulthood rather than activation of a distinct regeneration-specific gene program. Furthermore, adult leukocytes and fibroblasts were characterized by the expression of a proliferative gene expression network following infarction, which mirrored the neonatal state. In contrast, cardiomyocytes failed to reactivate the neonatal proliferative network following infarction, which was associated with loss of chromatin accessibility around cell cycle genes during postnatal maturation.

Conclusions: This work provides a comprehensive framework and transcriptional resource of multiple cardiac cell populations during cardiac development, repair, and regeneration. Our findings define a regulatory program underpinning the neonatal regenerative state and identify alterations in the chromatin landscape that could limit reinduction of the regenerative program in adult cardiomyocytes.

Keywords: ATAC-seq; cell proliferation; epigenomics; muscle cells; myocardial infarction; regeneration; transcriptional profiling.


Figures

Figure 1.
Figure 1.
Isolation, sorting, and RNA-sequencing analysis of multiple cardiac cell populations during development and regeneration. A, Schematic of cardiac cell–sorting strategy and RNA-sequencing pipeline. Myo (purple) indicates cardiomyocytes; Fibro (green), CD90+ fibroblasts; Leuko (red), leukocytes; Endo (blue), endothelial cells; ShP1.d3, sham surgery at P1 and collected at day 3 postsurgery; MIP1.d3, MI at P1 and collected at day 3 postsurgery; ShP56.d3, sham surgery at P56 and collected at day 3 postsurgery; and MIP56.d3, MI at P56 and collected at day 3 postsurgery. B, Purity of isolated cardiac cell populations based on expression of known cardiac cell type–specific markers. n=4 per group. CPM indicates counts per million. C, Proportion of nonmyocyte populations in each group measured by fluorescence-activated cell sorting. D, Differentially expressed genes for each cell type between sham-operated and infarcted mice at neonatal or adult stages (ShP1.d3 versus ShP56.d3 and MIP1.d3 versus MIP56.d3).
Figure 2.
Figure 2.
RNA-sequencing analysis reveals that cardiac cell types have distinct transcriptional behaviors during development and myocardial infarction. A, Principal coordinate analysis for each cell population. The arrows emphasize the developmental transition from neonatal to adult stages in the absence of injury (ie, ShP1.d3 versus ShP56.d3) followed by their transition following myocardial infarction at P56. B, Pearson correlations between RNA-sequencing samples for each cell type. Blue indicates ShP1.d3; purple, MIP1.d3; green, ShP56.d3; and red, MIP56.d3. C, Hierarchical clustering of significantly regulated genes. Gene ontology analysis of cell-specific clusters reveals enrichment of cell-specific gene ontology terms. Headings in each box denote cell type–specific enrichment of each cluster. Statistical significance is represented by P value adjusted for multiple comparisons with a false discovery rate <0.05. Myo indicates cardiomyocytes; Leuko, leukocytes; Fibro, CD90+ fibroblasts; and Endo, endothelial cells.
Figure 3.
Figure 3.
Identification of transcription factors and signaling pathways governing cardiac cell identity. A, Representative subset of overconnected genes for each cell type. Each data set was collated by identifying genes specifically enriched in each cell type at all time points. MetaCore was used to identify core genes in each cellular data set. * denotes genes that were not only overconnected but also differentially expressed in the data set. B, Enriched pathways and gene ontologies in each cell type. Pathways and ontologies are ranked based on –log(P value) from left to right. Representative gene ontologies and pathways are highlighted with colored circles. Endo indicates endothelial cells; Fibro, CD90+ fibroblasts; IL-8, interleukin 8; Leuko, leukocytes; Myo, cardiomyocytes; PIP3, phosphatidylinositol 3,4,5-trisphosphate; TGFβ, transforming growth factor β; and VEGF, vascular endothelial growth factor.
Figure 4.
Figure 4.
Injury-induced transcriptional responses in multiple cardiac cell populations following neonatal or adult myocardial infarction. A, Volcano plots portray differentially expressed genes in different cell types in the neonate (P1) following myocardial infarction or sham surgery. Red dots denote significantly regulated genes (false discovery rate ≤ 0.05, log2(fold change) ≥ 1 or ≤ –1). N signifies the number of differentially expressed genes. Gene ontology analysis was performed for each comparison. B, Volcano plots portray differentially expressed genes in different cell types in the adult (P56) following myocardial infarction or sham surgery. Gene ontology analysis was performed for each comparison. Endo indicates endothelial cells; Fibro, CD90+ fibroblasts; Leuko, leukocytes; Myo, cardiomyocytes; and N/A, not available.
Figure 5.
Figure 5.
Different cardiac cell types exhibit unique transcription factor and gene network usage during cardiac development and following MI. A, Overconnected transcription factors and signaling molecules are shown for each cellular data set. Overconnected genes following MI in neonatal cell types are shown in red boxes, whereas overconnected adult genes are shown in blue boxes. # denotes genes that are specifically regulated following MI (MIP1.d3 versus MIP56.d3), whereas genes without # are also regulated during development (ShP1.d3 versus ShP56.d3). B, Gene networks and associated signaling pathways were assembled and ranked for each cell type after sham (ShP1.d3 versus ShP56.d3) or MI (MIP1.d3 versus MIP56.d3). Endo indicates endothelial cells; Fibro, CD90+ fibroblasts; Leuko, leukocytes; MI, myocardial infarction; and Myo, cardiomyocytes.
Figure 6.
Figure 6.
Adult cardiomyocytes and endothelial cells fail to reactivate the neonatal proliferative network following myocardial infarction. A, Heat map showing a subset of transcripts that are commonly downregulated (n=644) or upregulated (n=217) during postnatal development (ShP1 versus ShP56) in all cardiac cell types. This cell cycle network includes genes that reverted to a neonatal-like signature following myocardial infarction (MIP56 versus MIP1) in adult leukocytes and CD90+ fibroblasts, but not myocytes and endothelial cells. Genes that exhibited the inverse expression profile are also shown. B, Overconnected transcription factors and key signaling molecules within the network were predominantly associated with cell cycle. The inverse expression profile was predominantly associated with metabolism. * indicates genes that were both overconnected and differentially expressed within the cell cycle network. C, Gene ontology analysis indicated that the genes that reverted to a neonatal signature in adult leukocytes and CD90+ fibroblasts were associated with cell cycle processes, whereas the inversely regulated genes were associated with autophagy and metabolism. Endo indicates endothelial cells; Fibro, CD90+ fibroblasts; Leuko, leukocytes; and Myo, cardiomyocytes.
Figure 7.
Figure 7.
Epigenetic and transcriptional profiling of cardiomyocytes during postnatal development reveals a loss of chromatin accessibility at cell cycle genes after P1. A, Schematic of Pcm1+ nuclei sorting for RNA-seq and ATAC-seq experiments. B, Heatmap of differentially expressed genes (RNA-seq) from P1 to P14 and P56. C, Heatmap of differentially accessible chromatin regions (ATAC-seq) from P1 to P14 and P56. D, Top, Venn diagram of all differentially regulated genes (no P value threshold) from RNA-seq and ATAC-seq data sets (1 kb ± transcription start site). A total of 11 308 genes were detected in both data sets. Bottom, Heatmap contour of integration of RNA-seq and ATAC-seq data sets showing a positive correlation between active transcription and open chromatin structure. E, Gene Set Enrichment Analysis for transcription factor targets in open chromatin regions associated with transcriptional activation at P1. Significance is represented as –log10 of P value. F, Gene Set Enrichment Analysis for transcription factor targets in open chromatin regions associated with transcriptional activation at P56. Significance is represented as –log10 of P value. G, Overlay of transcription factors that control the cell cycle network and transcription factors associated with genes highly expressed at P1 from euchromatic promoters. The P values of the transcription factors in the inset table were calculated from either the cell cycle network (cellular RNA-seq reversion signature) or from highly expressed genes at P1 euchromatic promoters (nuclear intersection of RNA-seq and ATAC-seq). ATAC-seq indicates Assay for Transposase-Accessible Chromatin; and RNA-seq, RNA sequencing.

Similar articles

Cited by

References

    1. Senyo SE, Steinhauser ML, Pizzimenti CL, Yang VK, Cai L, Wang M, Wu TD, Guerquin-Kern JL, Lechene CP, Lee RT. Mammalian heart renewal by pre-existing cardiomyocytes. Nature. 2013;493:433–436. doi: 10.1038/nature11682. - PMC - PubMed
    1. Porrello ER, Mahmoud AI, Simpson E, Hill JA, Richardson JA, Olson EN, Sadek HA. Transient regenerative potential of the neonatal mouse heart. Science. 2011;331:1078–1080. doi: 10.1126/science.1200708. - PMC - PubMed
    1. Porrello ER, Mahmoud AI, Simpson E, Johnson BA, Grinsfelder D, Canseco D, Mammen PP, Rothermel BA, Olson EN, Sadek HA. Regulation of neonatal and adult mammalian heart regeneration by the miR-15 family. Proc Natl Acad Sci U S A. 2013;110:187–192. doi: 10.1073/pnas.1208863110. - PMC - PubMed
    1. Haubner BJ, Adamowicz-Brice M, Khadayate S, Tiefenthaler V, Metzler B, Aitman T, Penninger JM. Complete cardiac regeneration in a mouse model of myocardial infarction. Aging (Albany NY) 2012;4:966–977. doi: 10.18632/aging.100526. - PMC - PubMed
    1. Kikuchi K, Holdway JE, Werdich AA, Anderson RM, Fang Y, Egnaczyk GF, Evans T, Macrae CA, Stainier DY, Poss KD. Primary contribution to zebrafish heart regeneration by gata4(+) cardiomyocytes. Nature. 2010;464:601–605. doi: 10.1038/nature08804. - PMC - PubMed

MeSH terms