. 2017 Jul 21;13(7):e1006921.
doi: 10.1371/journal.pgen.1006921. eCollection 2017 Jul.

Mutations in the Caenorhabditis elegans orthologs of human genes required for mitochondrial tRNA modification cause similar electron transport chain defects but different nuclear responses

Affiliations

Mutations in the Caenorhabditis elegans orthologs of human genes required for mitochondrial tRNA modification cause similar electron transport chain defects but different nuclear responses

Carmen Navarro-González et al. PLoS Genet. .

Abstract

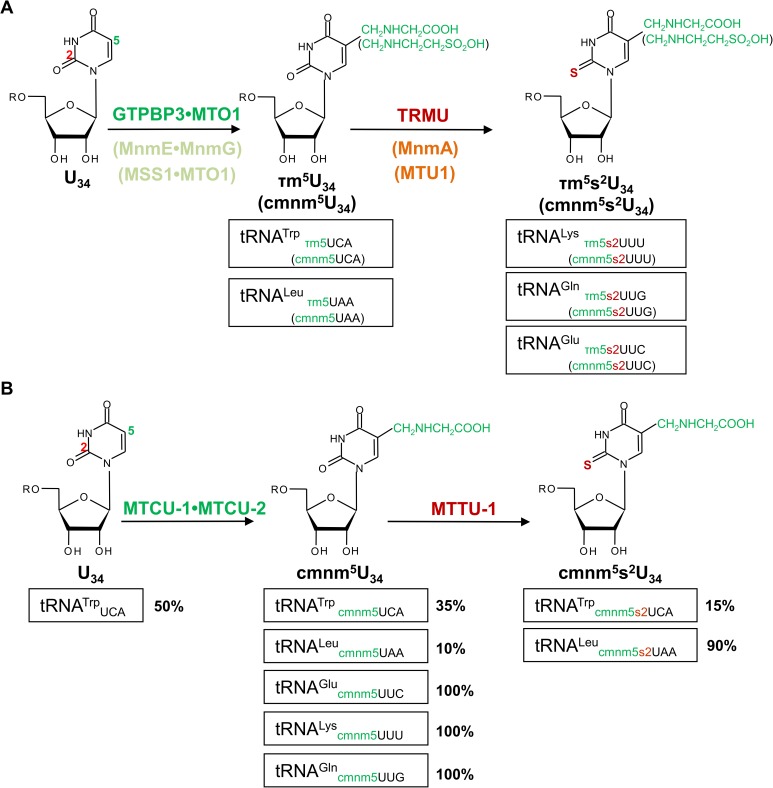
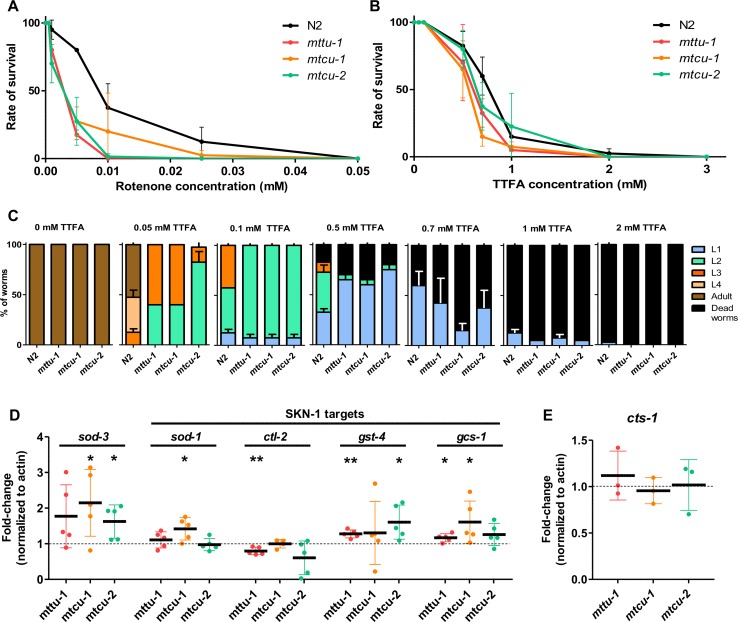
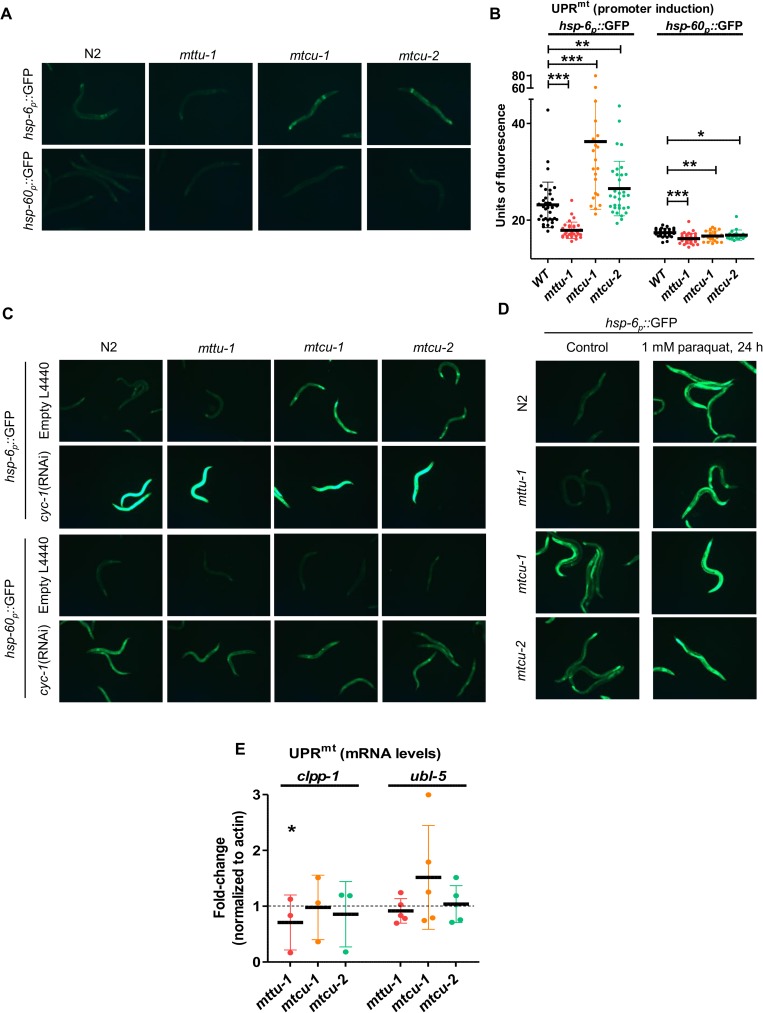
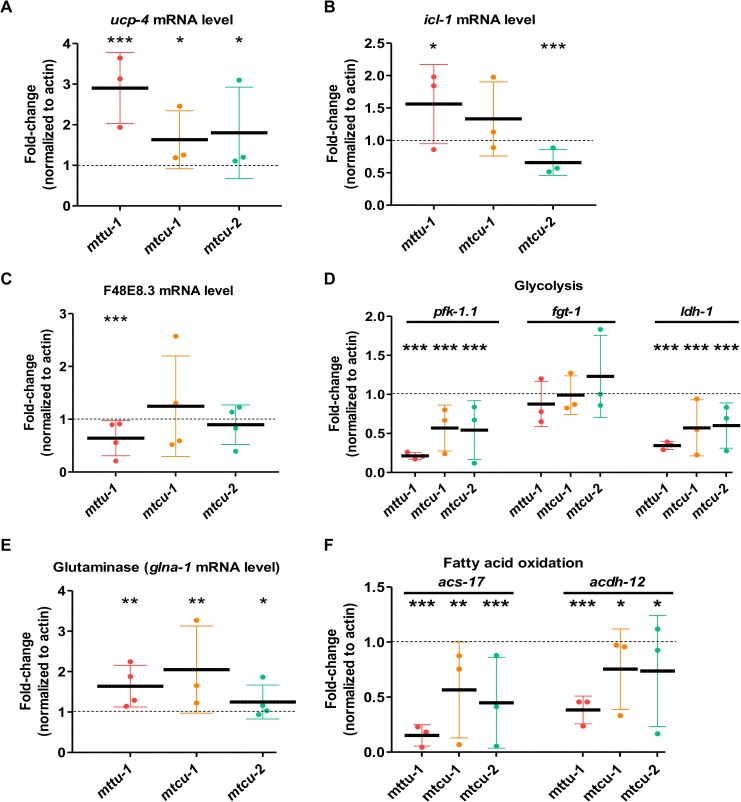
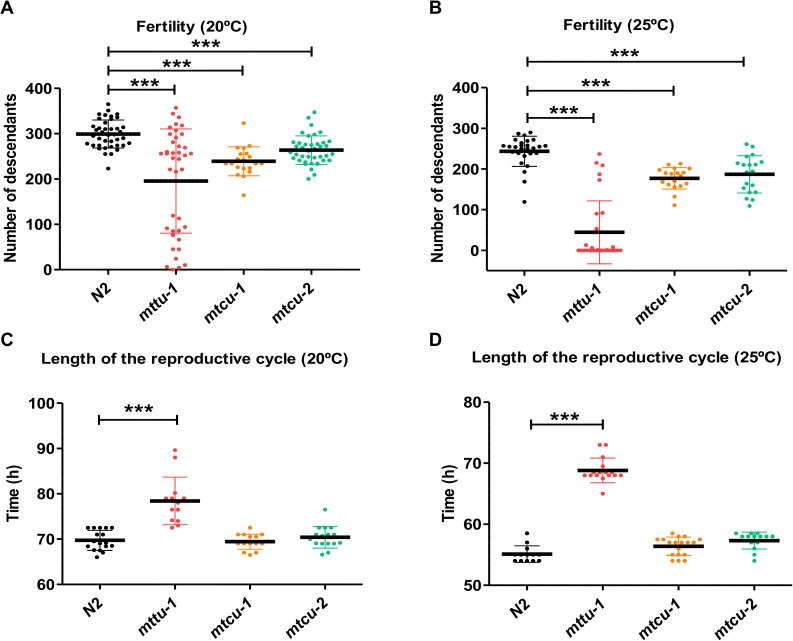
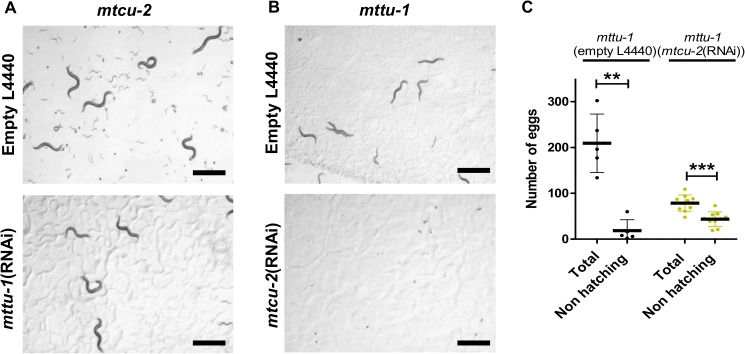
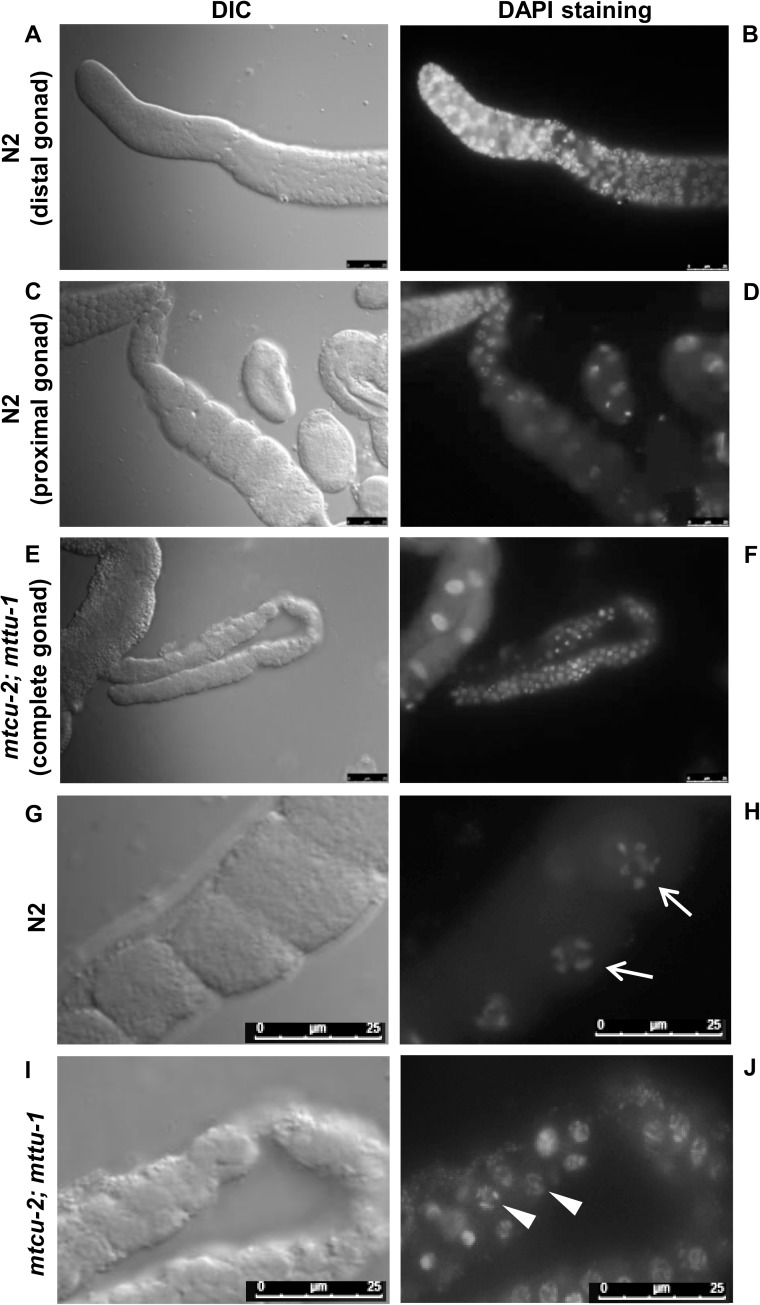
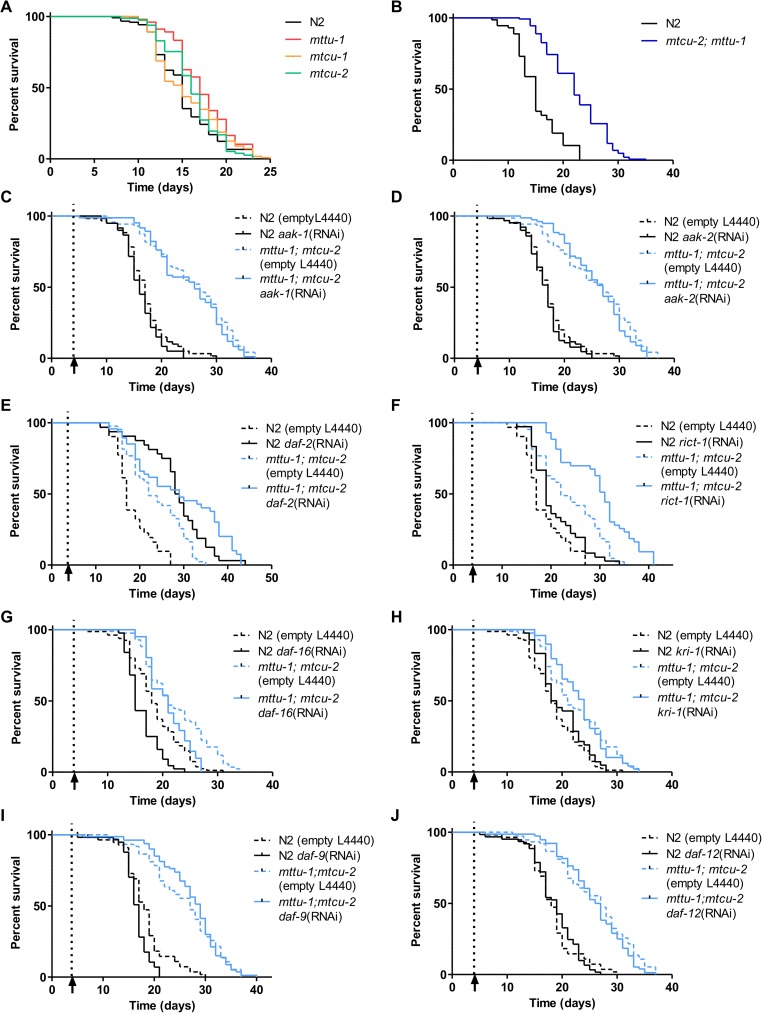
Several oxidative phosphorylation (OXPHOS) diseases are caused by defects in the post-transcriptional modification of mitochondrial tRNAs (mt-tRNAs). Mutations in MTO1 or GTPBP3 impair the modification of the wobble uridine at position 5 of the pyrimidine ring and cause heart failure. Mutations in TRMU affect modification at position 2 and cause liver disease. Presently, the molecular basis of the diseases and why mutations in the different genes lead to such different clinical symptoms is poorly understood. Here we use Caenorhabditis elegans as a model organism to investigate how defects in the TRMU, GTPBP3 and MTO1 orthologues (designated as mttu-1, mtcu-1, and mtcu-2, respectively) exert their effects. We found that whereas the inactivation of each C. elegans gene is associated with a mild OXPHOS dysfunction, mutations in mtcu-1 or mtcu-2 cause changes in the expression of metabolic and mitochondrial stress response genes that are quite different from those caused by mttu-1 mutations. Our data suggest that retrograde signaling promotes defect-specific metabolic reprogramming, which is able to rescue the OXPHOS dysfunction in the single mutants by stimulating the oxidative tricarboxylic acid cycle flux through complex II. This adaptive response, however, appears to be associated with a biological cost since the single mutant worms exhibit thermosensitivity and decreased fertility and, in the case of mttu-1, longer reproductive cycle. Notably, mttu-1 worms also exhibit increased lifespan. We further show that mtcu-1; mttu-1 and mtcu-2; mttu-1 double mutants display severe growth defects and sterility. The animal models presented here support the idea that the pathological states in humans may initially develop not as a direct consequence of a bioenergetic defect, but from the cell's maladaptive response to the hypomodification status of mt-tRNAs. Our work highlights the important association of the defect-specific metabolic rewiring with the pathological phenotype, which must be taken into consideration in exploring specific therapeutic interventions.


Conflict of interest statement

The authors have declared that no competing interests exist.

Figures

Fig 1
Fig 1. Modification of the wobble uridine (U34) in mitochondrial and bacterial tRNAs.
Schema of the U34 modification pathways in human and yeast mt-tRNAs and Escherichia coli tRNAs (A) and A. suum mt-tRNAs (B). In A, proteins GTPBP3, MTO1, and TRMU (also named MTU1) from humans, and MSS1, MTO1, and MTU1, from yeast, are orthologous of the bacterial MnmE, MnmG and MnmA proteins, respectively. Taurine (humans) and glycine (E. coli and yeast) are used to introduce the τm and cmnm groups into position 5 of U34. In B, MTCU-1, MTCU-2 and MTTU-1 are the nematode orthologues of GTPBP3, MTO1, and TRMU, respectively, and their roles are inferred from studies of the E. coli and yeast proteins. The fractions of A. suum modified mt-tRNAs, according to the study by Sakurai et al. [28], are indicated below the schema. Note that mt-tRNAGlu, mt-tRNALys and mt-tRNAGln are fully modified at position 5 but lack thiolation at position 2, whereas most mt-tRNAUAALeu (~90%) is modified at both positions (2 and 5), and about 50% of mt-tRNATrp molecules do not contain any modification at the U34.
Fig 2
Fig 2. Effect of the mttu-1, mtcu-1 and mtcu-2 mutations on the modification status and steady-state levels of mt-tRNAs.
(A and B) Analysis of the 2-thiolation status of mt-tRNAUAALeu (A) and mt-tRNAGln (B) by APM-Northern blotting. Total small RNAs obtained from mixed-stage populations of liquid-cultured worms were purified from wild-type (N2) and mttu-1, mtcu-1 or mtcu-2 strains, and analyzed in 10% polyacrylamide/8 M urea gels with (+) or without (-) 0.01 mg/ml APM. At least three replicates were performed. #Total small RNA stained with methylene blue. (C-F) Northern blot analysis of mt-tRNAUAALeu molecules after digestion with angiogenin in vitro. Three μg of total small RNA obtained from mixed-stage populations of liquid-cultured worms from N2 and mtcu-2 (C) or mtcu-1 (E) strains were digested with 12.5 μg/ml of angiogenin for the indicated times and mt-tRNAUAALeu and cyt-tRNALys were detected with a specific probe. Quantification of at least two independent assays similar to those shown in C and E is given in D and F, respectively. (G) Quantification of the steady-state levels of mt-tRNAUAALeu, mt-tRNAGln and 5S rRNA in mttu-1, mtcu-1 and mtcu-2 single mutants in comparison to the steady-state levels in wild-type strain (n≥3). (H) Quantification of mtDNA/nDNA ratio by qPCR. Four L4 worms grown at 20°C were used to quantify the mtDNA/nDNA ratio in each strain (n = 3). Error bars indicate ± SD (standard deviation). Statistical significance was evaluated with Student’s unpaired t-test. ** and *** denote p<0.01 and p<0.001, respectively.
Fig 3
Fig 3. mttu-1, mtcu-1 and mtcu-2 mutants display mild mitochondrial defects.
(A) Representative western blot of protein extracts from young adults worms (day 1 of adulthood) probed with antibodies to NUO-2 (complex I), CTC-1(COX-1) (complex IV), ATP-2 (complex V) and actin. (B) Densitometric analysis of blots obtained from at least three independent experiments. The steady state levels of the OXPHOS subunits were normalized with respect to actin and are represented as the equivalent amounts in wild type. Error bars indicate standard deviation (SD). * denotes p<0.05, ***, p = 0.0001. (C, D) Quantitation of (C) TMRE staining (n>4) (D) and MitoTracker Red staining (n>9) in L4 worms during 16 h. *p<0.05, ***p = 0.0002. (E) Graph showing the AMP/ATP ratio in the indicated strains at L4 stage. The wild-type strain (N2) treated for 2 h with 1 mM sodium azide (SA), which blocks ATP production, was included in the analysis as a positive control (n = 3). ***p<0.001. Statistical significance was evaluated with Student’s unpaired t-test. Data is represented as mean ± SD.
Fig 4
Fig 4. Mitochondrial respiratory capacity of the mttu-1, mtcu-1, mtcu-2 and mtcu-2; mttu-1 mutants.
(A-C) Basal (A) and maximal (B) oxygen consumption rates and spare respiratory capacity (C) of worms grown at 20°C. Statistical significance for the double mutant was evaluated with unpaired T-test with Welch’s correction. *** denotes p<0.0001. (D-F) Basal (D) and maximal (E) oxygen consumption rates and spare respiratory capacity (F) of worms grown at 25°C. Statistical significance for the single mutants was evaluated with one-way ANOVA with a Dunnett’s post hoc test for multiple comparisons. *, ** and *** denote p<0.05, p<0.01 and p<0.001, respectively. Data is represented as mean ± SD.
Fig 5
Fig 5. The single mutants exhibit higher sensitivity to inhibitors of complex I and II and mild antioxidant response.
(A, B) Graphs showing survival of L1 worms after a 4-day exposure to different concentrations of the complex I inhibitor, rotenone (A) or the complex II inhibitor, TTFA (B) (n = 3). (C) Percentage of worms at different developmental stages and dead animals after a 4-day exposure to different concentrations of the complex II inhibitor TTFA. Treatment was initiated in synchronized L1 populations. (D, E) Quantitation of sod-3, sod-1, ctl-2, gst-4, gcs-1 and cts-1 mRNA levels by qRT-PCR in the indicated strains at L4 stage of development (n≥3). The mRNA levels were normalized to act-1 and the wild-type strain. * denotes p<0.05, **, p<0.01 and ***, p<0.001. Statistical significance was evaluated with Student’s unpaired t-test and data is represented as mean ± SD.
Fig 6
Fig 6. Expression of UPRmt markers in mttu-1, mtcu-1 and mtcu-2 mutant strains.
(A and B) Expression of the hsp-6p::GFP or hsp-60p::GFP reporters in the indicated strains. Representative fluorescence micrographs of wild-type and single mutants harbouring hsp-6p::GFP or hsp-60p::GFP transgenes at L4 stage of development are shown in (A). Quantification is shown in (B) (n>20). * denotes p<0.05, **, p<0.01 and ***, p<0.001. (C) Fluorescence micrographs of wild-type and single mutants harbouring hsp-6p::GFP or hsp-60p::GFP transgenes at L4 stage of development after cyc-1(RNAi) from the L1 stage. (D) Fluorescence micrographs of one-day old, adult wild type and single mutants harbouring hsp-6p::GFP transgene exposed to 1 mM paraquat for 24 h. Note that cyc-1(RNAi) (C) and paraquat treatment (D) cause marked increases in GFP expression. (E) Quantitation of clpp-1 and ubl-5 mRNA levels by qRT-PCR in the indicated strains at L4 stage (n≥3). The mRNA levels were normalized to those of act-1 in the wild-type strain. Statistical significance was evaluated with Student’s unpaired t-test. Error bars indicate standard deviation (SD). *, p<0.05.
Fig 7
Fig 7. mRNA expression of metabolic genes in mttu-1, mtcu-1 and mtcu-2 single mutants.
(A-F) qRT-PCR analysis of mRNA expression of genes related to 1) succinate import to mitochondria (ucp-4, panel A), 2) glyoxylate cycle (icl-1, panel B), 3) malate dismutation (F48E8.3, panel C), 4) glycolysis (pfk-1.1, fgt-1 and ldh-1, panel D), 5) glutaminolysis (glna-1, panel E), and 6) fatty acid oxidation (acs-17 and acdh-12, panel F) in synchronized L4 populations. The mRNA levels of the selected genes were normalized to those of act-1 in the wild-type strain (n≥3). * denotes p<0.05, **p<0.01 and ***p<0.001. Statistical significance was evaluated with Student’s unpaired t-test.
Fig 8
Fig 8. Effect of the mttu-1, mtcu-1 and mtcu-2 mutations on fecundity and reproductive cycle length.
(A, B) Fertility of the wild-type (N2), mttu-1, mtcu-1 and mtcu-2 strains was measured by the number of progeny laid by adult hermaphrodite worms at 20°C (A) and 25°C (B) (n≥2). (C, D) Length of the reproductive cycle in the wild-type, mttu-1, mtcu-1 and mtcu-2 strains at 20°C (C) and 25°C (D) (n≥3). *** denotes p<0.001. Statistical significance was evaluated with Student’s unpaired t-test.
Fig 9
Fig 9. Simultaneous lack of mitochondrial MTTU-1 and MTCU-2 proteins is associated with embryonic lethality, developmental defects and sterility.
(A) Silencing of mttu-1 in the mtcu-2 mutant (from L4 stage onwards) at 25°C produces a slower rate of development and sterility of their progeny. (B) and (C) Silencing of mtcu-2 in the mttu-1 mutant (from L4 stage onwards) at 25°C causes arrest of development at the L1-L2 stages (B) and embryonic lethality (C). The total number of eggs and the number that failed to hatch were quantified (n≥5). **p<0.01, ***p<0.001. Statistical significance was evaluated with Student’s unpaired t-test. Error bars indicate standard deviation (SD).
Fig 10
Fig 10. The simultaneous lack of mitochondrial MTTU-1 and MTCU-2 proteins causes gonadal defects.
(A, C, E, G and I) Nomarski differential contrast (DIC) and (B, D, F, H and J) fluorescence micrographs of DAPI-stained dissected gonads from N2 wild-type and mtcu-2; mttu-1 double mutant hermaphrodites. Distal (A and B) and proximal (C and D) gonad from a wild-type hermaphrodite, as well as a complete gonad from an mtcu-2; mttu-1 double mutant (E and F) are shown. (G-J) Detail of the proximal region of gonads from N2 and mtcu-2; mttu-1 strains. In N2 worms, germ cells in this region are in diplotene and bivalents (white arrows) are visible in cells progressing to form oocytes, which are arrested at diakinesis. In the mtcu-2; mttu-1 double mutant in contrast, no bivalents or mature oocytes were visible (the white arrowheads indicate germ cell nuclei arrested in diplotene). Scale bar: 25 μm. Pictures shown in A to F were taken at the same magnification as were those in G to J.
Fig 11
Fig 11. Simultaneous inactivation of MTTU-1 and MTCU-2 leads to lifespan extension in C. elegans.
(A) Survival of the wild-type strain and the mttu-1, mtcu-1 and mtcu-2 single mutants at 20°C (n = 4). (B) Survival of the wild-type strain and the mtcu-2; mttu-1 double mutant at 20°C (n = 3). (C-J) aak-1 (n = 2) (C), aak-2 (n = 2) (D), daf-2 (n = 1) (E), rict-1 (n = 1) (F), daf-16 (n = 2) (G), kri-1 (n = 2) (H), daf-9 (n = 2) (I), and daf-12 (n = 2) (J) silencing effect on the survival of the N2 and mtcu-2; mttu-1 strains at 20°C. The empty vector L4440 was used as a negative control. Animals used for controls were of the same age as the experimental animals. To avoid disturbing embryonic development, silencing was started at the L4 stage (pointed with and arrow and a dashed line). Statistical significance was evaluated with Log-rank (Mantel Cox test) and Gehan-Breslow-Wilcoxon test and statistics are shown in Table 1.

Similar articles

Cited by

References

    1. Reinecke F, Smeitink JA, van der Westhuizen FH. OXPHOS gene expression and control in mitochondrial disorders. Biochim Biophys Acta. 2009;1792(12):1113–21. doi: 10.1016/j.bbadis.2009.04.003 . - DOI - PubMed
    1. Chandel NS. Mitochondria as signaling organelles. BMC biology. 2014;12:34 doi: 10.1186/1741-7007-12-34 ; PubMed Central PMCID: PMC4035690. - DOI - PMC - PubMed
    1. Tait SW, Green DR. Mitochondria and cell signaling. J Cell Sci. 2012;125(Pt 4):807–15. doi: 10.1242/jcs.099234 ; PubMed Central PMCID: PMC3311926. - DOI - PMC - PubMed
    1. Haynes CM, Yang Y, Blais SP, Neubert TA, Ron D. The matrix peptide exporter HAF-1 signals a mitochondrial unfolded protein response by activating the transcription factor ZC376.7 in C. elegans. Mol Cell. 2010;37(4):529–40. doi: 10.1016/j.molcel.2010.01.015 - DOI - PMC - PubMed
    1. Nunnari J, Suomalainen A. Mitochondria: in sickness and in health. Cell. 2012;148(6):1145–59. doi: 10.1016/j.cell.2012.02.035 . - DOI - PMC - PubMed

MeSH terms

Grants and funding

This work has been supported by grants from the Spanish Ministry of Economy and Competitiveness (grant numbers BFU2010-19737 and BFU2014-58673-P) and Generalitat Valenciana (grant number PROMETEO/2012/061) to MEA. CNG was the recipient of a fellowship from the Spanish Ministry of Economy and Competitiveness (BES-2011-047037). The funders had no role in study design, data collection and analysis, decision to publish, or preparation of the manuscript.