. 2017 Oct;162(10):3103-3118.
doi: 10.1007/s00705-017-3482-2. Epub 2017 Jul 12.

Autophagy induced by bovine viral diarrhea virus infection counteracts apoptosis and innate immune activation

Affiliations

Autophagy induced by bovine viral diarrhea virus infection counteracts apoptosis and innate immune activation

Yulong Zhou et al. Arch Virol. 2017 Oct.

Abstract

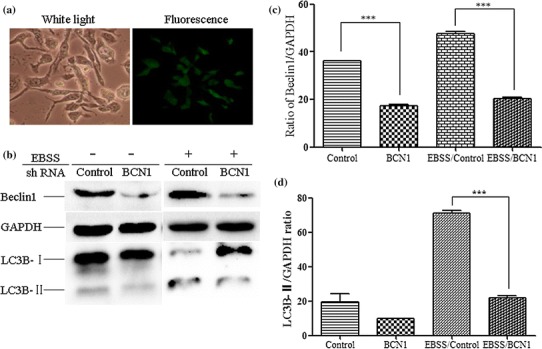
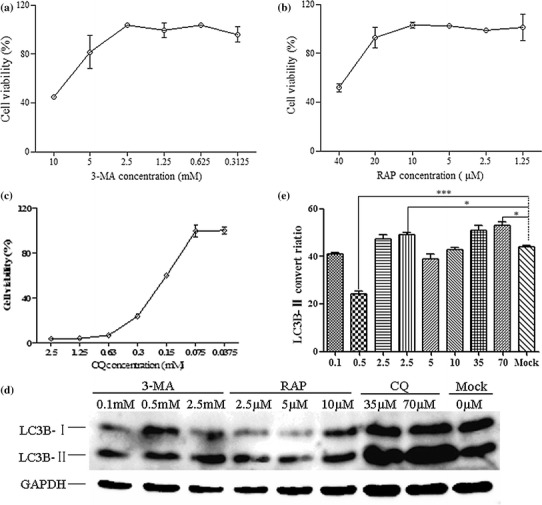
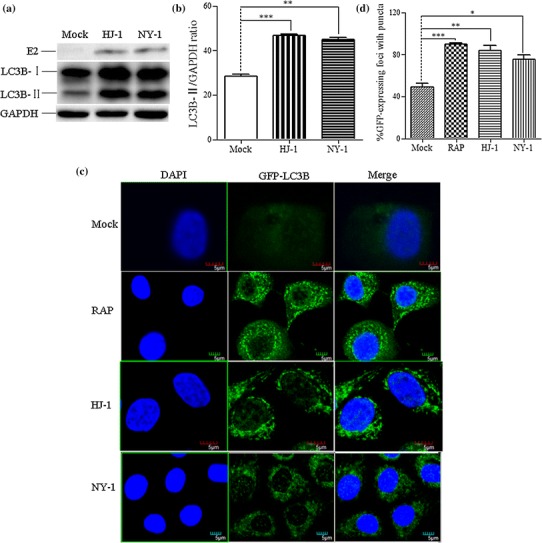
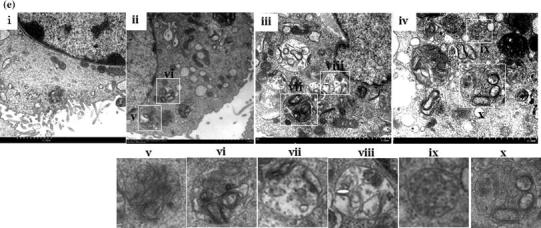
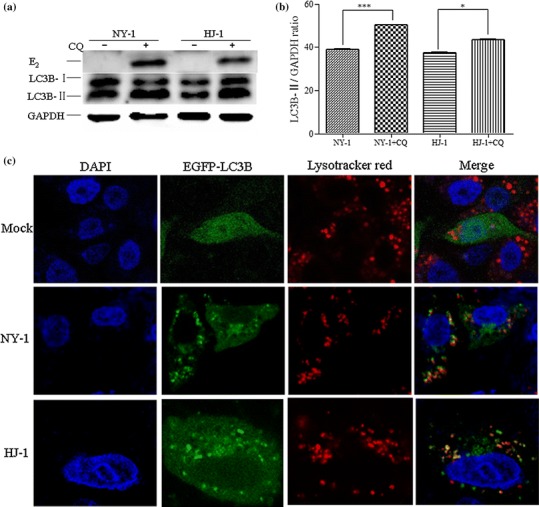
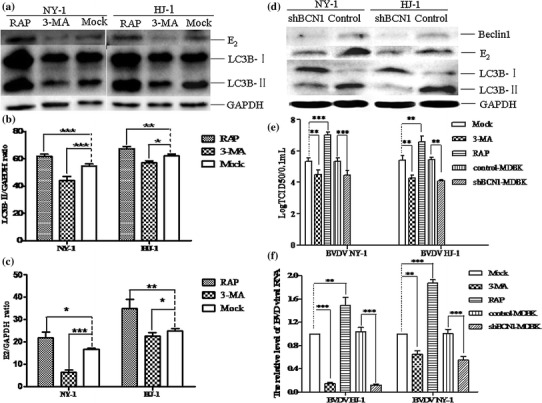
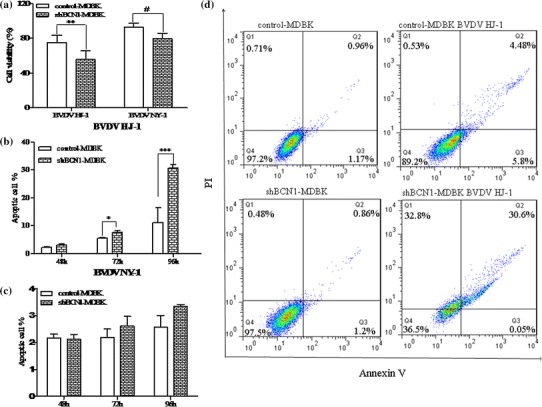
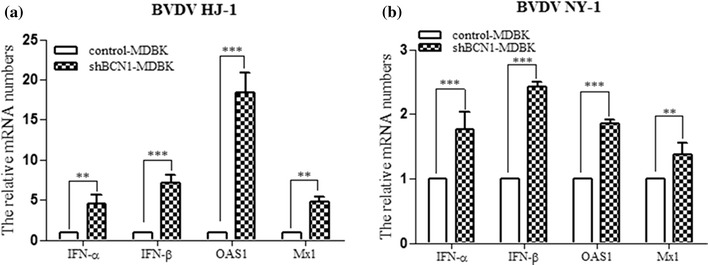
Bovine viral diarrhea virus (BVDV) is an important pathogen of cattle that plays a complex role in disease. There are two biotypes of BVDV: non-cytopathic (NCP) and cytopathic (CP). One strategy that has been used to treat or prevent virus-associated diseases is the modulation of autophagy, which is used by the innate immune system to defend against viral infection; however, at present, the interplay between autophagy and BVDV remains unclear. Madin-Darby bovine kidney cells stably expressing microtubule-associated protein 1 light chain 3B (LC3B) with green fluorescent protein (GFP) (GFP-LC3-MDBK cells) and autophagy-deficient MDBKs (shBCN1-MDBK cells) were constructed. Then MDBK, GFP-LC3-MDBK and shBCN1-MDBK cells were infected with CP or NCP BVDV strains. The LC3-II turnover rate was estimated by western blot, autophagosomes were visualized by confocal microscopy, and ultrastructural analysis was performed using electron microscopy. Autophagy flux was observed using chloroquine as an inhibitor of the autophagic process. The influence of autophagy on BVDV replication and release was investigated using virus titration, and its effect on cell viability was also studied. The effect of BVDV-induced autophagy on the survival of BVDV-infected host cell, cell apoptosis, and interferon (IFN) signalling was studied by flow cytometric analysis and quantitative RT-(q)PCR using shBCN1-MDBK cells. we found that infection with either CP or NCP BVDV strains induced steady-state autophagy in MDBK cells, as evident by the increased number of double- or single-membrane vesicles, the accumulation of GFP- microtubule-associated protein 1 light chain 3 (LC3) dots, and the conversion of LC3-I (cytosolic) to LC3-II (membrane-bound) forms. The complete autophagic process was verified by monitoring the LC3-II turnover ratio, lysosomal delivery, and proteolysis. In addition, we found that CP and NCP BVDV growth was inhibited in MDBK cells treated with high levels of an autophagy inducer or inhibitor, or in autophagy deficient-MDBK cells. Furthermore, our studies also suggested that CP and NCP BVDV infection in autophagy-knockdown MDBK cells increased apoptotic cell death and enhanced the expression of the mRNAs for IFN-α, Mx1, IFN-β, and OAS-1 as compared with control MDBK cells. Our study provides strong evidence that BVDV infection induces autophagy, which facilitates BVDV replication in MDBK cells and impairs the innate immune response. These findings might help to illustrate the pathogenesis of persistent infection caused by BVDV.


Conflict of interest statement

The authors declare that they have no competing interests.

Figures

Fig. 1
Fig. 1
Generation of stable GFP-LC3-MDBK and shBCN1-MDBK cells. (a) Generation of GFP-LC3-MDBK stable cells. MDBK cells were transfected with 4 μg of pEGFP-LC3 plasmid, and fluorescence microscopy was used to identify stably transfected cells in the presence of 250 μg of G418 per ml. (b) Western blot analysis. MDBK cells were transfected with 4 μg of control shRNA plasmid or BCN1 shRNA plasmid, and the stable cells were screened in the presence of 0.1 μg of purine per ml. The control-MDBK or shBCN1-MDBK cells were starved in Earle’s balanced salt solution for 120 min. The cells were then lysed, and the protein levels were determined by western blot analysis. (c) Analysis of the band intensity ratio of BCN1 to GAPDH using ImageJ2x software. The results are indicated by graphs representing the ratio of BCN1 to GAPDH normalized to the control. (d) Analysis of the band intensity ratio of LC3-II to GAPDH. The results are indicated with graphs representing the ratio of LC3-II to GAPDH normalized to the control. The data are reported as the mean ± SD (n = 3). Significance was analysed using a two-tailed Student’s t-test. ***, P < 0.001
Fig. 2
Fig. 2
Optimum concentration of inducers or inhibitors of autophagy. (a-c) Cytotoxicity assays of 3-MA, RAP, and CQ. MDBK cells were treated with each drug at different concentrations for 12 h. The cell culture medium was replaced with fresh DMEM medium, the cells were cultured for 72 h, and cell viability was then quantitated. (d) Western blot analysis. MDBK cells were treated with each drug as described above at 0.1, 0.5, and 2.5 mM for 3-MA, 2.5, 5.0, and 10 μM for RAP, and 35 and 70 μM for CQ. (e) Analysis of the band intensity ratio of LC3-II to GAPDH. The results are indicated with graphs representing the ratio of LC3-II to GAPDH normalized to the control. The data are reported as the mean ± SD (n = 3). Significance was analysed using a two-tailed Student’s t-test. *, P < 0.05; ***, P < 0.001
Fig. 3
Fig. 3
BVDV infection triggers autophagy in MDBK cells. (a) Western blot analysis. The turnover of LC3-I to LC3-II was detected for MDBK cells infected with NY-1 or HJ-1 at an m.o.i. of 2.5 or 5. Cells were harvested at 72 h postinfection and tested using an anti-LC3B antibody. GAPDH was used as a protein loading control. (b) The band intensity ratio of LC3-II to GAPDH. The results are indicated by graphs representing the ratio of LC3-II to GAPDH normalized to the control. The data are reported as the mean ± SD (n = 3). Significance was analysed using a two-tailed Student’s t-test. *, P < 0.05; ***, P < 0.001. (c) Confocal microscopy. MDBK/GFP-LC3 cells were mock treated as a negative control, with RAP as a positive control, or infected with NY-1 or HJ-1 at an m.o.i. of 2.5 or 5. (d) Proportion of GFP-expressing cells with puncta formation. For each sample, the total number of GFP-expressing foci and the number of foci with GFP puncta were counted in four separate fields. Data from at least four independent experiments were used for the analysis. Significance was analysed using a two-tailed Student’s t-test. *, P < 0.05; **, P < 0.01; ***, P < 0.001. (e) TEM observation of autophagosomes in MDBK cells. MDBK cells were mock treated as a negative control (i) or RAP as a positive control (ii), or infected with NY-1 or HJ-1 at an m.o.i. of 2.5 or 5 (iii, iv). Higher-magnification views of panels ii, iii, and iv are shown in panels v-x. Bars, 2 μm
Fig. 3
Fig. 3
BVDV infection triggers autophagy in MDBK cells. (a) Western blot analysis. The turnover of LC3-I to LC3-II was detected for MDBK cells infected with NY-1 or HJ-1 at an m.o.i. of 2.5 or 5. Cells were harvested at 72 h postinfection and tested using an anti-LC3B antibody. GAPDH was used as a protein loading control. (b) The band intensity ratio of LC3-II to GAPDH. The results are indicated by graphs representing the ratio of LC3-II to GAPDH normalized to the control. The data are reported as the mean ± SD (n = 3). Significance was analysed using a two-tailed Student’s t-test. *, P < 0.05; ***, P < 0.001. (c) Confocal microscopy. MDBK/GFP-LC3 cells were mock treated as a negative control, with RAP as a positive control, or infected with NY-1 or HJ-1 at an m.o.i. of 2.5 or 5. (d) Proportion of GFP-expressing cells with puncta formation. For each sample, the total number of GFP-expressing foci and the number of foci with GFP puncta were counted in four separate fields. Data from at least four independent experiments were used for the analysis. Significance was analysed using a two-tailed Student’s t-test. *, P < 0.05; **, P < 0.01; ***, P < 0.001. (e) TEM observation of autophagosomes in MDBK cells. MDBK cells were mock treated as a negative control (i) or RAP as a positive control (ii), or infected with NY-1 or HJ-1 at an m.o.i. of 2.5 or 5 (iii, iv). Higher-magnification views of panels ii, iii, and iv are shown in panels v-x. Bars, 2 μm
Fig. 4
Fig. 4
HJ-1 or NY-1 induces the complete autophagic process in MDBK cells. (a) The accumulation of autophagosomes was detected by western blot. MDBK cells were mock treated or treated with CQ at 75 μM for 12 h, after MDBK cells were infected with HJ-1 or NY-1 at an m.o.i. of 5 or 2.5. (b) The band intensity ratio of LC3-II to GAPDH. The results are indicated by graphs representing the ratio of LC3-II to GAPDH normalized to the control. The data are reported as the mean ± SD (n = 3). Significance was analysed using a two-tailed Student’s t-test. *, P < 0.05; ***, P < 0.001. (c) Colocalization of autophagosomes with lysosomes by confocal microscopy observed. MDBK cells transfected with GFP-LC3 were mock infected or infected with HJ-1 or NY-1 at an m.o.i. of 5 or 2.5, and LysoTracker Red was then added to the culture for 2 h. The images were analysed using a laser scanning confocal microscope
Fig. 5
Fig. 5
Autophagy promotes BVDV replication in MDBK cells. (a) Effect of drugs on BVDV-mediated autophagy. MDBK cells were treated with 3-MA or RAP at 0.5 mM and 2.5 μM for 12 h and then infected with HJ-1 or NY-1 at an m.o.i. of 5 or 2.5 for 72 h. The cell samples were then collected for western blot analysis. (b, c) Analysis of the band intensity ratio of LC3-II or E2 to GAPDH. The results are indicated by graphs representing the ratio of LC3-II or E2 to GAPDH normalized to the control. (d) BVDV-mediated autophagy in shBCN1-MDBK cells. shBCN1-MDBK cells or control-MDBK cells were infected with HJ-1 or NY-1 at an m.o.i. of 5 or 2.5 for 72 h, and the cell samples were collected for western blot analysis. (e) The viral titres of drug-treated MDBK cells or shBCN1-MDBK cells. After drug-treated MDBK cells or shBCN1-MDBK cells were infected with HJ-1 or NY-1, the cell supernatant of the samples was freeze-thawed three times and used to determine the titer using a TCID50 assay. (f) Relative levels of BVDV RNA. MDBK cells or shBCN1-MDBK cells were treated as described above (a) or (f), and total RNA was isolated. The data are reported as the mean ± SD (n = 3). The data were analysed using a two-tailed Student’s t- test. *, P < 0.05; **, P < 0.01; ***, P < 0.001
Fig. 6
Fig. 6
BVDV infection in autophagy-knockdown MDBK cells induces enhanced apoptosis. (a) Cell viability. shBCN1-MDBK cells and control-MDBK cells were infected with HJ-1 or NY-1 at an m.o.i. of 5 or 2.5 for 72 h, and MTS was added to the medium to detect the level of absorption. (b, c) Cell apoptosis after treatment with HJ-1 or NY-1 for 48, 72, and 96 h. (d) Apoptosis (%) of shBCN1-MDBK cells and control-MDBK cells after treatment with HJ-1 or NY-1 for 96 h. Significance was analysed using a two-tailed Student’s t-test. *, P < 0.05; **, P < 0.01; ***, P < 0.01
Fig. 7
Fig. 7
BVDV infection upregulates IFN signalling molecules in Beclin 1-knockdown MDBK cells. Intracellular mRNA was extracted from (a) HJ-1-infected shBCN1-MDBK cells or (b) NY-1-infected shBCN1-MDBK cells. Intracellular mRNA expression of IFN-β, OAS-1, IFN-α, and Mx1 was detected by real-time, RT-PCR. GAPDH was used as an internal control. The fold changes in mRNA levels are presented after normalization with a mock-infected control. The data are reported as the mean ± SD (n = 3). Significance was analysed using a two-tailed Student’s t-test. **, P < 0.01; ***, P < 0.001

Similar articles

Cited by

References

    1. Levine B, Kroemer G. Autophagy in the pathogenesis of disease. Cell. 2008;132:27–42. doi: 10.1016/j.cell.2007.12.018. - DOI - PMC - PubMed
    1. Jordan TX, Randall G. Manipulation or capitulation: virus interactions with autophagy. Microbes Infect. 2012;14:126–139. doi: 10.1016/j.micinf.2011.09.007. - DOI - PMC - PubMed
    1. Rubinsztein DC, Codogno P, Levine B. Autophagy modulation as a potential therapeutic target for diverse diseases. Nat Rev Drug Discov. 2012;11:709–730. doi: 10.1038/nrd3802. - DOI - PMC - PubMed
    1. Kubalia P, Nolte WM, Castoreno AB, Xavier RJ. Autophagy and the immune system. Annu Rev Immunol. 2012;30:611–646. doi: 10.1146/annurev-immunol-020711-074948. - DOI - PubMed
    1. Deretic V, Levine B. Autophagy, immunity, and microbial adaptations. Cell Host Microbe. 2009;5:527–549. doi: 10.1016/j.chom.2009.05.016. - DOI - PMC - PubMed

LinkOut - more resources