Physiological roles of sigma factor SigD in Corynebacterium glutamicum
- PMID: 28701150
- PMCID: PMC5508688
- DOI: 10.1186/s12866-017-1067-6
Physiological roles of sigma factor SigD in Corynebacterium glutamicum
Abstract
Background: Sigma factors are one of the components of RNA polymerase holoenzymes, and an essential factor of transcription initiation in bacteria. Corynebacterium glutamicum possesses seven genes coding for sigma factors, most of which have been studied to some detail; however, the role of SigD in transcriptional regulation in C. glutamicum has been mostly unknown.
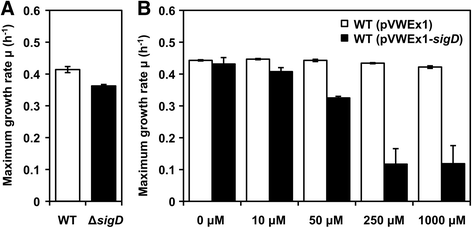
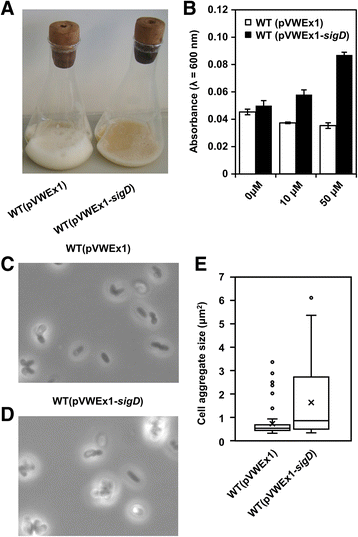
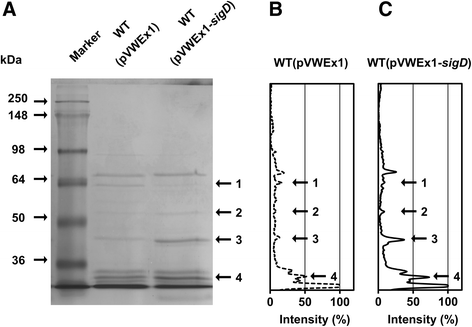
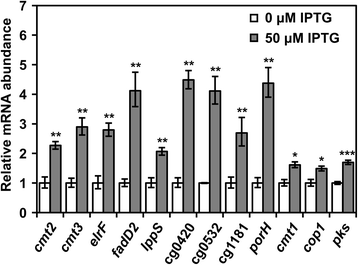
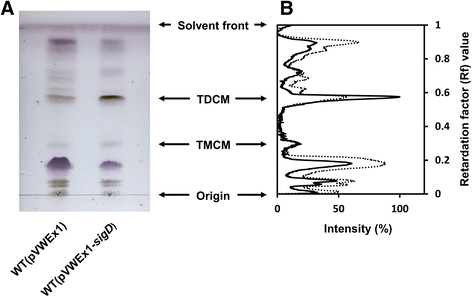
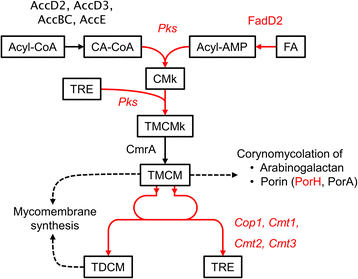
Results: In this work, pleiotropic effects of sigD overexpression at the level of phenotype, transcripts, proteins and metabolites were investigated. Overexpression of sigD decreased the growth rate of C. glutamicum cultures, and induced several physiological effects such as reduced culture foaming, turbid supernatant and cell aggregation. Upon overexpression of sigD, the level of Cmt1 (corynomycolyl transferase) in the supernatant was notably enhanced, and carbohydrate-containing compounds were excreted to the supernatant. The real-time PCR analysis revealed that sigD overexpression increased the expression of genes related to corynomycolic acid synthesis (fadD2, pks), genes encoding corynomycolyl transferases (cop1, cmt1, cmt2, cmt3), L, D-transpeptidase (lppS), a subunit of the major cell wall channel (porH), and the envelope lipid regulation factor (elrF). Furthermore, overexpression of sigD resulted in trehalose dicorynomycolate accumulation in the cell envelope.
Conclusions: This study demonstrated that SigD regulates the synthesis of corynomycolate and related compounds, and expanded the knowledge of regulatory functions of sigma factors in C. glutamicum.
Keywords: Corynebacterium glutamicum; Mycomembrane; SigD; Sigma factor; Trehalose dicorynomycolate.
Conflict of interest statement
Author’s information
HT currently belongs to Synthetic Bioengineering lab, Dept.of Biotechnology, Graduate School of Engineering, Osaka University (Yamadaoka 2-1, Suita, Osaka, 565-0871, Japan).
Ethics approval and consent to participate
Not applicable.
Consent for publication
Not applicable.
Competing interests
The authors declare that they have no competing interests.
Publisher’s Note
Springer Nature remains neutral with regard to jurisdictional claims in published maps and institutional affiliations.
Figures
Similar articles
-
Identification and functional analysis of six mycolyltransferase genes of Corynebacterium glutamicum ATCC 13032: the genes cop1, cmt1, and cmt2 can replace each other in the synthesis of trehalose dicorynomycolate, a component of the mycolic acid layer of the cell envelope.Arch Microbiol. 2003 Jul;180(1):33-44. doi: 10.1007/s00203-003-0556-1. Epub 2003 May 10. Arch Microbiol. 2003. PMID: 12740729
-
Extracytoplasmic function sigma factor σD confers resistance to environmental stress by enhancing mycolate synthesis and modifying peptidoglycan structures in Corynebacterium glutamicum.Mol Microbiol. 2018 Feb;107(3):312-329. doi: 10.1111/mmi.13883. Epub 2017 Dec 8. Mol Microbiol. 2018. PMID: 29148103
-
Sigma factors and promoters in Corynebacterium glutamicum.J Biotechnol. 2011 Jul 10;154(2-3):101-13. doi: 10.1016/j.jbiotec.2011.01.017. Epub 2011 Jan 26. J Biotechnol. 2011. PMID: 21277915 Review.
-
Use of In Vitro Transcription System for Analysis of Corynebacterium glutamicum Promoters Recognized by Two Sigma Factors.Curr Microbiol. 2016 Sep;73(3):401-408. doi: 10.1007/s00284-016-1077-x. Epub 2016 Jun 6. Curr Microbiol. 2016. PMID: 27270733
-
Analysis of Corynebacterium glutamicum promoters and their applications.Subcell Biochem. 2012;64:203-21. doi: 10.1007/978-94-007-5055-5_10. Subcell Biochem. 2012. PMID: 23080252 Review.
Cited by
-
Deciphering the Adaptation of Corynebacterium glutamicum in Transition from Aerobiosis via Microaerobiosis to Anaerobiosis.Genes (Basel). 2018 Jun 13;9(6):297. doi: 10.3390/genes9060297. Genes (Basel). 2018. PMID: 29899275 Free PMC article.
-
Genome-wide identification of novel genes involved in Corynebacteriales cell envelope biogenesis using Corynebacterium glutamicum as a model.PLoS One. 2020 Dec 31;15(12):e0240497. doi: 10.1371/journal.pone.0240497. eCollection 2020. PLoS One. 2020. PMID: 33383576 Free PMC article.
-
Overlap of Promoter Recognition Specificity of Stress Response Sigma Factors SigD and SigH in Corynebacterium glutamicum ATCC 13032.Front Microbiol. 2019 Jan 9;9:3287. doi: 10.3389/fmicb.2018.03287. eCollection 2018. Front Microbiol. 2019. PMID: 30687273 Free PMC article.
-
The conserved σD envelope stress response monitors multiple aspects of envelope integrity in corynebacteria.PLoS Genet. 2024 Jun 3;20(6):e1011127. doi: 10.1371/journal.pgen.1011127. eCollection 2024 Jun. PLoS Genet. 2024. PMID: 38829907 Free PMC article.
-
Eliminating the capsule-like layer to promote glucose uptake for hyaluronan production by engineered Corynebacterium glutamicum.Nat Commun. 2020 Jun 19;11(1):3120. doi: 10.1038/s41467-020-16962-7. Nat Commun. 2020. PMID: 32561727 Free PMC article.
References
MeSH terms
Substances
LinkOut - more resources
Full Text Sources
Other Literature Sources
Miscellaneous

