. 2017 Nov 2;36(44):6074-6084.
doi: 10.1038/onc.2017.204. Epub 2017 Jul 10.

Cross talk between progesterone receptors and retinoic acid receptors in regulation of cytokeratin 5-positive breast cancer cells

Affiliations

Cross talk between progesterone receptors and retinoic acid receptors in regulation of cytokeratin 5-positive breast cancer cells

L M Fettig et al. Oncogene. .

Abstract

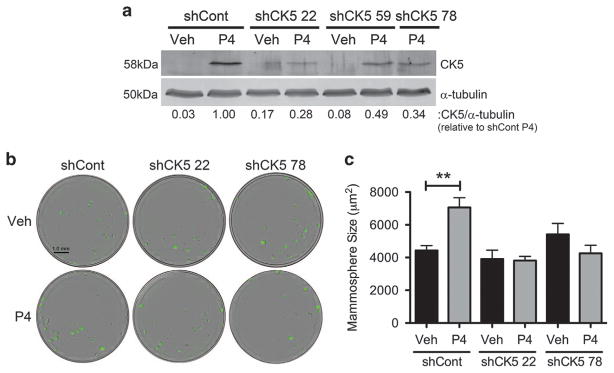
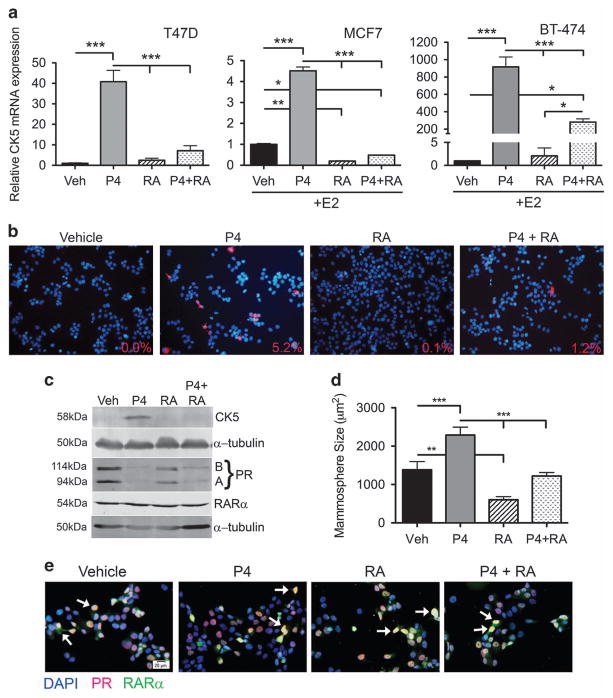
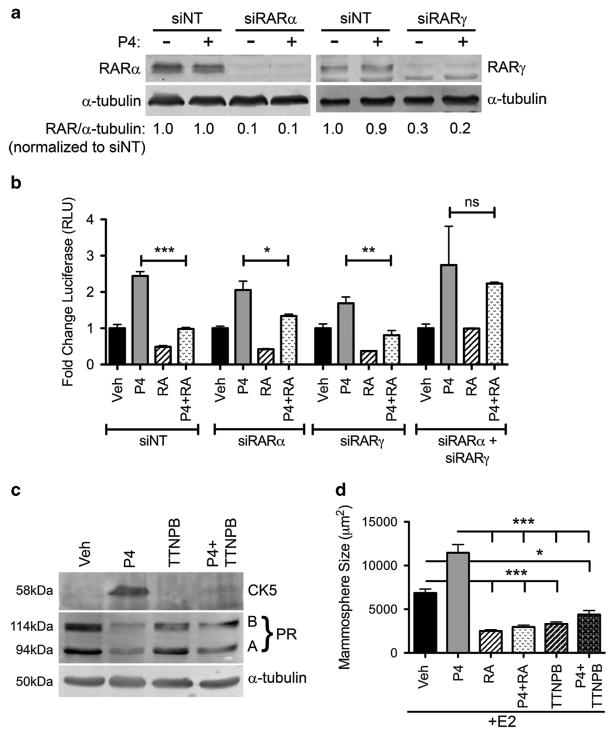
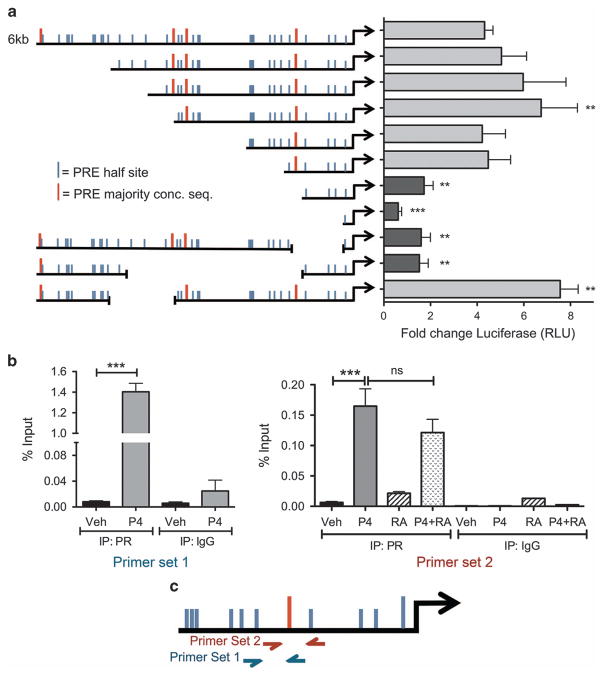
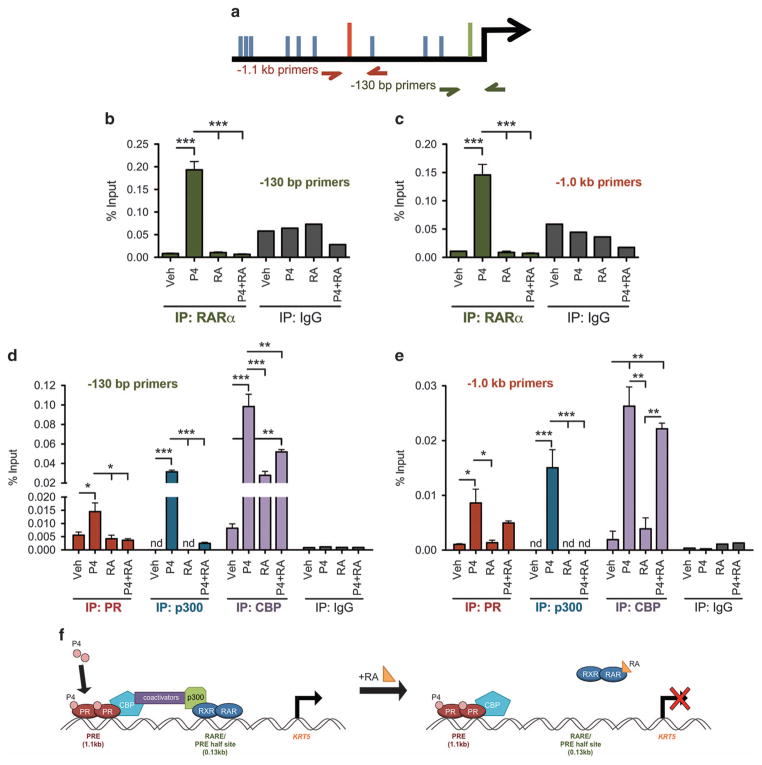
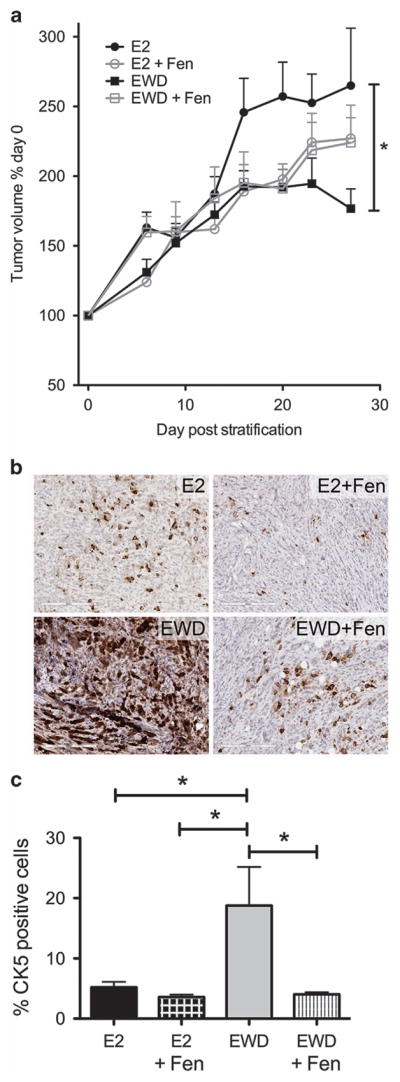
Half of estrogen receptor-positive breast cancers contain a subpopulation of cytokeratin 5 (CK5)-expressing cells that are therapy resistant and exhibit increased cancer stem cell (CSC) properties. We and others have demonstrated that progesterone (P4) increases CK5+ breast cancer cells. We previously discovered that retinoids block P4 induction of CK5+ cells. Here we investigated the mechanisms by which progesterone receptors (PR) and retinoic acid receptors (RAR) regulate CK5 expression and breast CSC activity. After P4 treatment, sorted CK5+ compared to CK5- cells were more tumorigenic in vivo. In vitro, P4-treated breast cancer cells formed larger mammospheres and silencing of CK5 using small hairpin RNA abolished this P4-dependent increase in mammosphere size. Retinoic acid (RA) treatment blocked the P4 increase in CK5+ cells and prevented the P4 increase in mammosphere size. Dual small interfering RNA (siRNA) silencing of RARα and RARγ reversed RA blockade of P4-induced CK5. Using promoter deletion analysis, we identified a region 1.1 kb upstream of the CK5 transcriptional start site that is necessary for P4 activation and contains a putative progesterone response element (PRE). We confirmed by chromatin immunoprecipitation that P4 recruits PR to the CK5 promoter near the -1.1 kb essential PRE, and also to a proximal region near -130 bp that contains PRE half-sites and a RA response element (RARE). RA induced loss of PR binding only at the proximal site. Interestingly, RARα was recruited to the -1.1 kb PRE and the -130 bp PRE/RARE regions with P4, but not RA alone or RA plus P4. Treatment of breast cancer xenografts in vivo with the retinoid fenretinide reduced the accumulation of CK5+ cells during estrogen depletion. This reduction, together with the inhibition of CK5+ cell expansion through RAR/PR cross talk, may explain the efficacy of retinoids in prevention of some breast cancer recurrences.


Conflict of interest statement

CONFLICT OF INTEREST

The authors declare no conflict of interest.

Figures

Figure 1
Figure 1
The P4-dependent increase in mammosphere size requires expression of CK5. (a) T47D cells with constitutive ZsGreen expression were stably transduced with either a non-targeting shRNA (shCont) or one of three shRNAs targeting CK5 (shCK5). CK5 expression in response to 24 h treatment with 100 nM P4 was analyzed by immunoblot, using α-tubulin as a loading control. CK5 expression is indicated compared to P4-treated control cells. (b) T47D-ZsGreen shCont and shCK5 (#22 or #78) cells were plated in Mammocult media at a density of 100 cells per well in quintuplicate in a 96-well plate and treated with either vehicle (EtOH) or 100 nM P4. After 2 weeks, mammospheres were imaged and analyzed using the IncuCyte Zoom live cell analysis system and software. Experiments were performed three times. Representative images of wells are shown. (c) Mammosphere size depicted for shCont and shCK5 cells treated with vehicle or P4. Data represent mean ± s.e.m. Veh and P4 treatments in each group were compared via Student’s t-test, **P < 0.01.
Figure 2
Figure 2
RA blocks P4-mediated CK5 expression and P4 induction of large mammospheres. (a) Treatment with RA blocks P4-induced CK5 transcription. T47D cells in a were treated with ethanol vehicle (veh), 100 nM P4, 100 nM 9-cis RA or P4 plus RA for 10 h. MCF7 and BT-474 cells were pretreated with 10 nM E2 for 48 h to induce PR expression, then treated in the same manner as T47D cells. Quantitative reverse-transcriptase PCR (qRT-PCR) was used to assess relative CK5 mRNA levels normalized to β-actin. Results are displayed as relative CK5 mRNA expression. Data represent mean ±s.e.m. Within each cell line all groups were compared via analysis of variance (ANOVA)/Tukey, *P<0.05 **P<0.01 ***P<0.001. Experiments were performed three times. (b) CK5+ cells were measured in T47D cells via immunocytochemistry after 24 h of the same treatments as in a. Fluorescent staining shows CK5 (red) and DAPI (blue). Percent CK5+ cells per field are indicated, calculated from five fields taken at × 10 magnification. (c) Immunoblot of CK5, PR (PRA and PRB isoforms indicated) and RARα in T47D cells under the same conditions as in a. α-tubulin was used as a loading control. (d) T47D-ZsGreen cells were plated at a density of 100 cells per well in quintuplicate in mammosphere media in 96-well plates plus indicated treatments. After 2 weeks, mammosphere size was analyzed via scanning on the IncuCyte Zoom. Experiments were repeated three times. Data represent mean ±s.e.m. All groups were compared via ANOVA/Tukey, **P<0.01 ***P<0.001. (e) Merged images of dual ICC for PR (red) and RARα (green) in T47D cells treated as in a for 24 h. Nuclei are counterstained with DAPI (blue). White arrows indicate examples of double positive cells.
Figure 3
Figure 3
RARs are required for RA inhibition of P4-induced CK5 expression and P4 production of large mammospheres. (a) T47D cells stably expressing a CK5 promoter-driven luciferase reporter were transfected with non-targeting siRNA (siNT), or siRNA to RARα or RARγ for 24 h, then treated with either ethanol vehicle or 100 nM P4 for an additional 24 h. Lysates were collected and analyzed by immunoblot. Relative RARα or RARγ levels are normalized to α-tubulin loading control and indicated relative to the vehicle treated siNT. (b) T47D cells were transfected as above and treated with vehicle, 100 nM P4, 100 nM 9-cis RA or both P4 plus RA. Lysates were collected and luciferase assays performed. Luciferase was graphed as fold change over vehicle control for each group of siRNAs. Experiments were performed three times. Data represent mean ±s.e.m. The four treatments were compared via analysis of variance (ANOVA)/Tukey within each of the siRNA groups, *P<0.05, **P<0.01, ***P<0.001. (c) T47D cells were treated with vehicle or P4 as above with the addition of two groups, 10 nM of the RAR selective agonist TTNPB minus or plus P4. CK5 and PR (PRA and PRB isoforms) expression were measured by immunoblot. (d) MCF7 cells stably expressing ZsGreen were plated at a density of 100 cells per well in quintuplicate in mammosphere media in 96-well plates and treated with 10 nM E2 (to induce PR levels) plus the following hormone combinations: ethanol vehicle, 100 nM P4, 100 nM 9-cis RA, P4 plus RA, 10 nM TTNPB or P4 plus TTNPB. After 2 weeks, mammospheres were analyzed using the IncuCyte Zoom. Data represent mean mammosphere size ±s.e.m. All groups were compared via ANOVA/Tukey, *P<0.05, **P<0.01, ***P<0.001. NS, not significant.
Figure 4
Figure 4
PR is recruited to the CK5 promoter near a PRE that is necessary for P4 transcriptional activation. (a) P4 action requires a region containing a putative PRE 1098 bp upstream of the TSS. Deletion constructs were engineered from a 6 kb fragment of the CK5 promoter upstream of luciferase in a lentiviral vector using existing restriction sites. The left side of the graph indicates relative size of the promoter construct with 5′ or internal deletions, and the location of putative PRE half-sites, or full majority consensus sequence based on that reported by Lieberman et al. and Graham et al. Constructs were transduced into T47D cells and stable puromycin resistant pools selected. Cells were then seeded at 5000 cells per well in 96-well plates and treated with vehicle or 100 nM P4 for 24 h. Lysates were collected and luciferase activity analyzed using the Luciferase Assay Kit (Promega). Relative fold changes are indicated for each construct over vehicle control. Experiments were repeated three times. Data represent mean ±s.e.m. Data were analyzed by analysis of variance (ANOVA)/Dunnett using the full-length 6 kb promoter construct as the control, **P<0.01, ***P<0.001. (b) ChIP using an antibody for PR or IgG control in T47D cells that were treated with vehicle, 100 nM P4, 100 nM 9-cis-RA or P4 plus RA. Experiments were performed three times. Data represent mean (percent input) ±s.e.m. Primer set one values were compared via Student’s t-test; for primer set two, each group (IgG or PR) was compared via ANOVA/Tukey post hoc, **P<0.01, ***P<0.001. (c) Diagram showing location of primer sets used in b. NS, not significant.
Figure 5
Figure 5
P4 recruits RARα and essential coactivators to the CK5 promoter while RA reduces RARα and coactivator occupancy. (a) Diagram showing location of primer sets used in b–e. (b) and (c) ChIP for RARα was performed on T47D cells treated with vehicle, 100 nM P4, P4 plus 100 nM 9-cis RA or P4 plus RA as indicated for 30 min pretreatment with RA or vehicle, followed by 1 h treatment with P4 or vehicle. quantitative PCR (qPCR) was performed for (b) a 200 bp region spanning the − 130 bp RARE, and (c) a 200 bp region spanning the − 1.1 kb PRE. Data represent mean ±s.e.m. IP conditions were compared via ANOVA/Tukey post hoc, ***P<0.001. (d) and (e) ChIP for PR, p300 and CBP was performed in T47D cells using primers for the two promoter regions as described in Figure 4b. nd, not detectable by qPCR. Experiments were repeated three times. Data represent mean (percent input) ±s.e.m. The four treatments within each group (IgG, RARα, PR, p300, CBP) were compared via analysis of variance/Tukey post hoc *P<0.05, **P<0.01, ***P<0.001. (f) Diagram of proposed coactivator bridging between enhancer elements. Under P4 conditions, PR and RARα occupy their respective response elements and coactivators form a functional bridge. RA removes RARα/p300 and reduces CPB occupancy, disrupting the bridge.
Figure 6
Figure 6
Co-treatment with retinoids during estrogen depletion reduces accumulation of CK5+ breast cancer cells. (a) A total of 1 × 10⁶ T47D cells were implanted into the left and right mammary fat pads of female NOD/SCID mice. Mice were given E2 pellets at time of cell injection. When tumors reached 75 mm3 average volume they were stratified into four treatment groups: continued on E2 (n =10 tumors), E2 plus fenretinide (Fen) (n =10 tumors), EWD (n =10 tumors) or EWD plus Fen (n =10 tumors). Change in tumor volumes relative to treatment start is plotted versus the number of days post treatment. Data represent mean ±s.e.m. Tumor volumes at the last time point were compared via analysis of variance (ANOVA)/Tukey, *P<0.05 (EWD versus E2). (b) Representative immunohistochemistry for CK5 in tumor sections from all treatment groups. (c) The percent of CK5+ cells was analyzed using an Aperio digital pathology microscope for whole sections of tumors in each group (n =3) and plotted as percent positive cells ±s.e.m. All groups were compared via ANOVA/Tukey, *P<0.05.

Similar articles

Cited by

References

    1. Cancer Genome Atlas N. Comprehensive molecular portraits of human breast tumours. Nature. 2012;490:61–70. - PMC - PubMed
    1. Osborne CK, Schiff R. Mechanisms of endocrine resistance in breast cancer. Annu Rev Med. 2011;62:233–247. - PMC - PubMed
    1. Allan AL, Vantyghem SA, Tuck AB, Chambers AF. Tumor dormancy and cancer stem cells: implications for the biology and treatment of breast cancer metastasis. Breast Dis. 2006;26:87–98. - PubMed
    1. Guedj M, Marisa L, de Reynies A, Orsetti B, Schiappa R, Bibeau F, et al. A refined molecular taxonomy of breast cancer. Oncogene. 2012;31:1196–1206. - PMC - PubMed
    1. Reya T, Morrison SJ, Clarke MF, Weissman IL. Stem cells, cancer, and cancer stem cells. Nature. 2001;414:105–111. - PubMed

Publication types

MeSH terms