. 2017 Sep 4;216(9):2959-2977.
doi: 10.1083/jcb.201611117. Epub 2017 Jul 7.

Membrane tension controls adhesion positioning at the leading edge of cells

Affiliations

Membrane tension controls adhesion positioning at the leading edge of cells

Bruno Pontes et al. J Cell Biol. .

Abstract

Cell migration is dependent on adhesion dynamics and actin cytoskeleton remodeling at the leading edge. These events may be physically constrained by the plasma membrane. Here, we show that the mechanical signal produced by an increase in plasma membrane tension triggers the positioning of new rows of adhesions at the leading edge. During protrusion, as membrane tension increases, velocity slows, and the lamellipodium buckles upward in a myosin II-independent manner. The buckling occurs between the front of the lamellipodium, where nascent adhesions are positioned in rows, and the base of the lamellipodium, where a vinculin-dependent clutch couples actin to previously positioned adhesions. As membrane tension decreases, protrusion resumes and buckling disappears, until the next cycle. We propose that the mechanical signal of membrane tension exerts upstream control in mechanotransduction by periodically compressing and relaxing the lamellipodium, leading to the positioning of adhesions at the leading edge of cells.


Figures

Figure 1.
Figure 1.
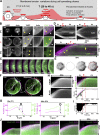
Adhesion dynamics correlates with membrane tension changes during spreading. (A) Cell spreading phases. Red arrows and curve, membrane tension. (B) VASP and actin during spreading. Dashed squares, zooms 1, 2, and 3; yellow arrowheads, VASP in clusters at the back of the lamellipodium; white arrowheads, VASP line at the tip of the leading edge. (C) Sequence of images showing VASP adhesion (green) dynamics relative to actin (magenta) during T. Lamellipodium decreases in size, and VASP adhesions organize as a row near the cell edge. (D) Kymograph of the cell presented in B (dashed line). Yellow arrowheads and arrow, VASP clusters in P1 and P2, respectively; magenta dashed curve, tangential guide to show the change in slope for the cell edge. (E) Row of adhesions positioned during T (increase in membrane tension) matures into focal adhesions later in P2, as indicated by the red outline (representing the adhesion row during T) superimposed with an image of the cell in late P2. (F) Procedure used to quantify adhesion positioning. Left, real frame of the cell; right, reconstructed cell; dashed lines, radius (x); blue dots, original edge position; red lines, aligned edge. (G) Representative mean intensity profiles for P1 and P2, with D (distance between the adhesion clusters and the cell edge) indicated. (H) Mean kymographs for VASP and actin and kymograph plot showing D (arrow in gray region). Magenta and green dashed lines, tangential guides to show the changes in slopes for the cell edge and adhesion clusters, respectively. Changes in slopes occur during T. (I) Variation of D during spreading. D changes from an initial ∼6-µm plateau (P1) to a ∼1-µm plateau (P2). T corresponds to the time necessary to change from one plateau to another (black dashed line, guide to show the change). (J) Mean kymographs for actin with other adhesion proteins. All procedures were repeated for at least 10 different spreading cells, and all showed behaviors similar to those represented in the figure. Bars, 10 µm.
Figure 2.
Figure 2.
Hypo-osmotic perturbation induces an increase in membrane tension. (A) Schematic of tether extraction experiment during a hypo-osmotic perturbation. Arrows and curve, membrane tension. (B) Representative bright-field image of a tether extraction experiment. Bar, 10 µm. (C) Representative tether extraction force curve, with tether forces for 1× and 0.5× Ringer’s indicated. (D) Plot of tether force values for fibroblast cells in 1× (blue box) and 0.5× (red box) Ringer’s. ***, P < 0.001, t test statistics. Blue and red boxes extend from the 25th to 75th percentiles, with a black line at the median and a black cross at the mean; black whiskers extend from 5th to 95th percentiles for both conditions; values outside these ranges are plotted as individual points. Five different paired measurements, among 25 pairs of 1×/0.5× Ringer’s, were chosen to represent the change in tether force observed in C. These paired measurements were correlated using a gray line in the plot.
Figure 3.
Figure 3.
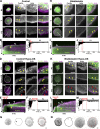
Membrane tension increase induces adhesion row positioning. Paxillin and actin behaviors followed in four conditions: control (A–C), hypo-OS (D–G), 10 µM BBI (H–J), and 10 µM BBI plus hypo-OS (K–N). (A, H, D, and K) Representative images in P1, T, or hypo-OS and P2 for actin and paxillin in all four conditions. Arrowheads, paxillin-containing adhesion clusters. (B, I, E, and L) Merged kymographs of paxillin (green) and actin (magenta) plotted from the dashed lines in A, D, H, and K. Yellow arrows, strips of paxillin-containing adhesions positioned during T (B and I) and hypo-OS (E and L); white arrows, strips of paxillin-containing adhesions positioned in P2 (after T or hypo-OS). (C, J, F, and M) Variations of D (in micrometers) during spreading for each experimental condition. Red dashed lines, beginning and end of T or hypo-OS. (G and N) Adhesion row positioned during hypo-OS (increase in membrane tension) matures into focal adhesions later in P2 in control case G but not in myosin II–inhibited cells in N, as indicated by the red outline (representing the adhesion row positioned during hypo-OS) superimposed with an image of the cell in late P2. All procedures were repeated for five different spreading cells of each experimental condition. All cells showed behaviors similar to those represented. Bars, 10 µm.
Figure 4.
Figure 4.
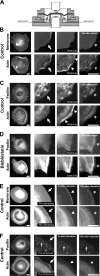
Membrane tension increase by cell stretching. (A) Schematic representation of the experimental setup used to stretch the cells. (B) Membrane and actin during cell stretching. Arrows, lamellipodial protrusion before stretch; arrowheads, collapse of the lamellipodial protrusion during stretch and formation of arc-shape structures at the cell edge; asterisks, lamellipodium reappearance when stretch is released. (C) Actin and paxillin during cell stretching. Arrows, lamellipodial protrusion before stretch; cross, paxillin focal adhesions at the back of the lamellipodium; arrowheads, collapse of the lamellipodial protrusion during stretch and formation of arc-shape structures at the cell edge; asterisks, lamellipodium reappearance when stretch is released. (D) Actin and paxillin during cell stretching in a BBI-treated cell. Asterisks, lamellipodium reappearance when stretch is released. (E) Membrane and actin during relaxation of prestretched PDMS substrate. Arrows, lamellipodial protrusion before relaxation; arrowheads, ruffling of the lamellipodial protrusion immediately after relaxation; asterisks, lamellipodium reappearance after relaxation. (F) Actin and paxillin during relaxation of prestretched PDMS substrate. Arrows, lamellipodial protrusion before relaxation; cross, paxillin focal adhesions at the back of the lamellipodium; arrowheads, ruffling of the lamellipodial protrusion immediately after relaxation; asterisks, lamellipodium reappearance after relaxation. All procedures were repeated for at least five different cells in each condition, and all showed behaviors similar to those represented in the figure. Bars, 10 µm.
Figure 5.
Figure 5.
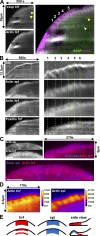
Cycles of actin buckling are correlated with adhesion positioning. (A) Tirf kymographs for VASP, actin, and their merge during five buckling cycles in P2. Arrowheads, adhesion rows. (B) DIC, epi (actin), and tirf (actin and paxillin) kymographs of a cell in P2 showing six buckling cycles. Dashed lines in zooms separate each buckling cycle. (C) Actin epi, actin tirf, and their merge showing the actin buckling at the leading edge of a spreading cell during P2. Top right color image is the same kymograph as in B, with actin epi (blue) and actin tirf (red). (D) Fluorescence intensity heat map of actin in tirf and epi for the same kymograph as in B. Fluorescence intensity levels (a.u.) are indicated as color bars. (E) Schematic top and side representations of actin buckling during P2, observed with tirf (red) and epi (blue). The experiment was repeated for 10 different spreading cells, and all show behaviors similar to those represented in the figure. Bar, 5 µm.
Figure 6.
Figure 6.
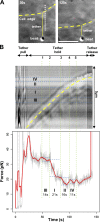
Membrane tether extraction experiment during P2. (A) Representative images of a membrane tether extraction. Yellow dashed lines, cell edge; white dashed line, region where the kymograph presented in B was generated. Bar, 5 µm. (B) Correlation between cell edge motion (kymograph) and tether force during four bucking cycles (I, II, III, and IV). Green dashed lines separate the buckling events as a function of edge position; blue dashed lines determine edge extension (in the kymograph) or variations in tension (in the curve) for each buckling event; plot in red, 2-s moving mean.
Figure 7.
Figure 7.
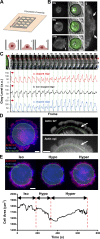
Mechanically mimicking the membrane tension load induces lamellipodial actin buckling. (A) Schematic representation of the experiment. (B) Representative cell spreading inside a well. Actin in tirf (left), actin merged with DIC (middle), and zoom at the moment actin encounters the barrier. Arrows, two actin buckling events. (C) Time-lapse analysis of the actin buckling for stopped edge (a [red] and c [blue]) or unstopped edge (b [dark]). Graphs represent the intensity profiles of the selected a, b, and c regions of each frame (1–20) of the panel on top of the graphs. Green dashed lines are guides to determine the limit of each frame. (D) Representative frame and zooms showing actin fluorescence (tirf in red and epi in blue) of a cell attached to a 45-µm-diameter fibronectin circle (green). Arrow, buckled actin. (E) Representative frames showing actin fluorescence (tirf in red and epi in blue) of a cell attached to a 40-µm-diameter fibronectin circle (green) during iso-, hypo-, and hypertonic exchanges. Plot represents the variation in the overall cell area (square micrometers) of actin epi during each of the media exchanges. Dashed lines are guides to determine each medium exchange. Bars: (B, D, and E) 10 µm; (B [zoom 1] and C) 1 µm.
Figure 8.
Figure 8.
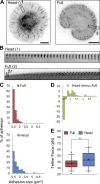
Adhesion dynamics is spatiotemporally correlated with an increase in membrane tension in a vinculin-dependent manner. (A) Representative images in late P2 of vinculin KO cells transfected with vinculin head and vinculin full. Bars, 10 µm. (B) Time-lapse images at the transition T of focal adhesions dynamics from A for vinculin head (1) and vinculin full (2). (C) Histogram of vinculin-containing adhesion sizes after 15-min spreading in vinculin full (red) and vinculin head (blue) cells. (D) Histogram of the shift in adhesion sizes from vinculin head to vinculin full. (E) Plot of the tether force values for vinculin full (red box) and vinculin head (blue box). **, P < 0.01 in t test statistics. Blue and red boxes extend from the 25th to 75th percentiles, with a black line at the median and a black cross at the mean; black whiskers extend from 5th to 95th percentiles for both conditions; values outside these ranges are plotted as individual points. The procedures in A–D were repeated for at least 15 different cells in each experimental condition. All cells showed behaviors similar to those represented in the figure. The procedures in E were repeated for at least 60 different cells of each experimental condition.
Figure 9.
Figure 9.
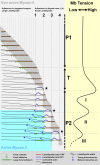
Schematic representation of membrane tension-mediated adhesion positioning during spreading. This figure is described in the Discussion.

Similar articles

Cited by

References

    1. Batchelder E.L., Hollopeter G., Campillo C., Mezanges X., Jorgensen E.M., Nassoy P., Sens P., and Plastino J.. 2011. Membrane tension regulates motility by controlling lamellipodium organization. Proc. Natl. Acad. Sci. USA. 108:11429–11434. 10.1073/pnas.1010481108 - DOI - PMC - PubMed
    1. Bear J.E., and Gertler F.B.. 2009. Ena/VASP: Towards resolving a pointed controversy at the barbed end. J. Cell Sci. 122:1947–1953. 10.1242/jcs.038125 - DOI - PMC - PubMed
    1. Bieling P., Li T.D., Weichsel J., McGorty R., Jreij P., Huang B., Fletcher D.A., and Mullins R.D.. 2016. Force feedback controls motor activity and mechanical properties of self-assembling branched actin networks. Cell. 164:115–127. 10.1016/j.cell.2015.11.057 - DOI - PMC - PubMed
    1. Burnette D.T., Manley S., Sengupta P., Sougrat R., Davidson M.W., Kachar B., and Lippincott-Schwartz J.. 2011. A role for actin arcs in the leading-edge advance of migrating cells. Nat. Cell Biol. 13:371–381. 10.1038/ncb2205 - DOI - PMC - PubMed
    1. Burnette D.T., Shao L., Ott C., Pasapera A.M., Fischer R.S., Baird M.A., Der Loughian C., Delanoe-Ayari H., Paszek M.J., Davidson M.W., et al. . 2014. A contractile and counterbalancing adhesion system controls the 3D shape of crawling cells. J. Cell Biol. 205:83–96. 10.1083/jcb.201311104 - DOI - PMC - PubMed

Publication types

MeSH terms