

Identification of Histamine H3 Receptor Ligands Using a New Crystal Structure Fragment-based Method
- PMID: 28684785
- PMCID: PMC5500575
- DOI: 10.1038/s41598-017-05058-w
Identification of Histamine H3 Receptor Ligands Using a New Crystal Structure Fragment-based Method
Abstract
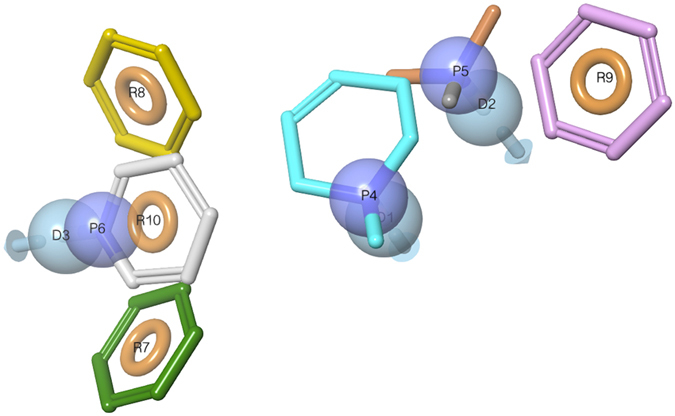
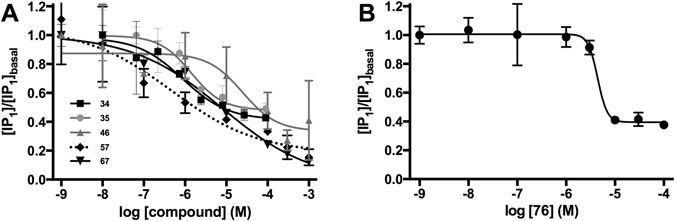
Virtual screening offers an efficient alternative to high-throughput screening in the identification of pharmacological tools and lead compounds. Virtual screening is typically based on the matching of target structures or ligand pharmacophores to commercial or in-house compound catalogues. This study provides the first proof-of-concept for our recently reported method where pharmacophores are instead constructed based on the inference of residue-ligand fragments from crystal structures. We demonstrate its unique utility for G protein-coupled receptors, which represent the largest families of human membrane proteins and drug targets. We identified five neutral antagonists and one inverse agonist for the histamine H3 receptor with potencies of 0.7-8.5 μM in a recombinant receptor cell-based inositol phosphate accumulation assay and validated their activity using a radioligand competition binding assay. H3 receptor antagonism is of large therapeutic value and our ligands could serve as starting points for further lead optimisation. The six ligands exhibit four chemical scaffolds, whereof three have high novelty in comparison to the known H3 receptor ligands in the ChEMBL database. The complete pharmacophore fragment library is freely available through the GPCR database, GPCRdb, allowing the successful application herein to be repeated for most of the 285 class A GPCR targets. The method could also easily be adapted to other protein families.
Conflict of interest statement
The authors declare that they have no competing interests.
Figures


Similar articles
-
Generation of a homology model of the human histamine H(3) receptor for ligand docking and pharmacophore-based screening.J Comput Aided Mol Des. 2007 Aug;21(8):437-53. doi: 10.1007/s10822-007-9127-x. Epub 2007 Aug 1. J Comput Aided Mol Des. 2007. PMID: 17668276
-
A qualitative model for the histamine H3 receptor explaining agonistic and antagonistic activity simultaneously.Arch Pharm (Weinheim). 2000 Aug;333(8):254-60. doi: 10.1002/1521-4184(20008)333:8<254::aid-ardp254>3.0.co;2-g. Arch Pharm (Weinheim). 2000. PMID: 11008375
-
Function-specific virtual screening for GPCR ligands using a combined scoring method.Sci Rep. 2016 Jun 24;6:28288. doi: 10.1038/srep28288. Sci Rep. 2016. PMID: 27339552 Free PMC article.
-
The challenge of drug discovery of a GPCR target: analysis of preclinical pharmacology of histamine H3 antagonists/inverse agonists.Biochem Pharmacol. 2006 Apr 14;71(8):1103-13. doi: 10.1016/j.bcp.2005.10.033. Epub 2006 Mar 2. Biochem Pharmacol. 2006. PMID: 16513092 Review.
-
Histamine H3 receptor and cholinesterases as synergistic targets for cognitive decline: Strategies to the rational design of multitarget ligands.Chem Biol Drug Des. 2021 Aug;98(2):212-225. doi: 10.1111/cbdd.13866. Epub 2021 Jun 21. Chem Biol Drug Des. 2021. PMID: 33991182 Review.
Cited by
-
Molecular Modeling of Histamine Receptors-Recent Advances in Drug Discovery.Molecules. 2021 Mar 22;26(6):1778. doi: 10.3390/molecules26061778. Molecules. 2021. PMID: 33810008 Free PMC article. Review.
-
Mind the Gap-Deciphering GPCR Pharmacology Using 3D Pharmacophores and Artificial Intelligence.Pharmaceuticals (Basel). 2022 Oct 22;15(11):1304. doi: 10.3390/ph15111304. Pharmaceuticals (Basel). 2022. PMID: 36355476 Free PMC article. Review.
-
Exploring G Protein-Coupled Receptors (GPCRs) Ligand Space via Cheminformatics Approaches: Impact on Rational Drug Design.Front Pharmacol. 2018 Mar 9;9:128. doi: 10.3389/fphar.2018.00128. eCollection 2018. Front Pharmacol. 2018. PMID: 29593527 Free PMC article. Review.
References
Publication types
MeSH terms
Substances
LinkOut - more resources
Full Text Sources
Other Literature Sources
Medical
