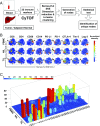
Delineation of an immunosuppressive gradient in hepatocellular carcinoma using high-dimensional proteomic and transcriptomic analyses
- PMID: 28674001
- PMCID: PMC5530700
- DOI: 10.1073/pnas.1706559114
Delineation of an immunosuppressive gradient in hepatocellular carcinoma using high-dimensional proteomic and transcriptomic analyses
Abstract
The recent development of immunotherapy as a cancer treatment has proved effective over recent years, but the precise dynamics between the tumor microenvironment (TME), nontumor microenvironment (NTME), and the systemic immune system remain elusive. Here, we interrogated these compartments in hepatocellular carcinoma (HCC) using high-dimensional proteomic and transcriptomic analyses. By time-of-flight mass cytometry, we found that the TME was enriched in regulatory T cells (Tregs), tissue resident memory CD8+ T cells (TRMs), resident natural killer cells (NKRs), and tumor-associated macrophages (TAMs). This finding was also validated with immunofluorescence staining on Foxp3+CD4+ and PD-1+CD8+ T cells. Interestingly, Tregs and TRMs isolated from the TME expressed multiple markers for T-cell exhaustion, including PD-1, Lag-3, and Tim-3 compared with Tregs and TRMs isolated from the NTME. We found PD-1+ TRMs were the predominant T-cell subset responsive to anti-PD-1 treatment and significantly reduced in number with increasing HCC tumor progression. Furthermore, T-bet was identified as a key transcription factor, negatively correlated with PD-1 expression on memory CD8+ T cells, and the PD-1:T-bet ratio increased upon exposure to tumor antigens. Finally, transcriptomic analysis of tumor and adjacent nontumor tissues identified a chemotactic gradient for recruitment of TAMs and NKRs via CXCR3/CXCL10 and CCR6/CCL20 pathways, respectively. Taken together, these data confirm the existence of an immunosuppressive gradient across the TME, NTME, and peripheral blood in primary HCC that manipulates the activation status of tumor-infiltrating leukocytes and renders them immunocompromised against tumor cells. By understanding the immunologic composition of this gradient, more effective immunotherapeutics for HCC may be designed.
Keywords: CyTOF; hepatocellular carcinoma; regulatory T cells; resident memory T cells; tumor microenvironment.
Conflict of interest statement
The authors declare no conflict of interest.
Figures


Similar articles
-
Tumor-infiltrating FoxP3+ Tregs and CD8+ T cells affect the prognosis of hepatocellular carcinoma patients.Digestion. 2012;86(4):329-37. doi: 10.1159/000342801. Epub 2012 Nov 28. Digestion. 2012. PMID: 23207161
-
CD38 marks the exhausted CD8+ tissue-resident memory T cells in hepatocellular carcinoma.Front Immunol. 2023 Jun 12;14:1182016. doi: 10.3389/fimmu.2023.1182016. eCollection 2023. Front Immunol. 2023. PMID: 37377962 Free PMC article.
-
Preferential accumulation of regulatory T cells with highly immunosuppressive characteristics in breast tumor microenvironment.Oncotarget. 2017 May 16;8(20):33159-33171. doi: 10.18632/oncotarget.16565. Oncotarget. 2017. PMID: 28388539 Free PMC article.
-
PD-1 immunobiology in autoimmune hepatitis and hepatocellular carcinoma.Semin Oncol. 2017 Dec;44(6):428-432. doi: 10.1053/j.seminoncol.2017.12.001. Epub 2018 Jan 6. Semin Oncol. 2017. PMID: 29935904 Free PMC article. Review.
-
Progression on the Roles and Mechanisms of Tumor-Infiltrating T Lymphocytes in Patients With Hepatocellular Carcinoma.Front Immunol. 2021 Sep 3;12:729705. doi: 10.3389/fimmu.2021.729705. eCollection 2021. Front Immunol. 2021. PMID: 34566989 Free PMC article. Review.
Cited by
-
Systemic Sclerosis Perturbs the Architecture of the Immunome.Front Immunol. 2020 Aug 6;11:1602. doi: 10.3389/fimmu.2020.01602. eCollection 2020. Front Immunol. 2020. PMID: 32849542 Free PMC article.
-
Overexpression of tousled-like kinase 2 predicts poor prognosis in HBV-related hepatocellular carcinoma patients after radical resection.Front Genet. 2024 Jan 26;14:1326737. doi: 10.3389/fgene.2023.1326737. eCollection 2023. Front Genet. 2024. PMID: 38343446 Free PMC article.
-
PD-1+ TIGIT+ CD8+ T cells are associated with pathogenesis and progression of patients with hepatitis B virus-related hepatocellular carcinoma.Cancer Immunol Immunother. 2019 Dec;68(12):2041-2054. doi: 10.1007/s00262-019-02426-5. Epub 2019 Nov 12. Cancer Immunol Immunother. 2019. PMID: 31720814 Free PMC article.
-
Rationale of Immunotherapy in Hepatocellular Carcinoma and Its Potential Biomarkers.Cancers (Basel). 2019 Dec 3;11(12):1926. doi: 10.3390/cancers11121926. Cancers (Basel). 2019. PMID: 31816940 Free PMC article. Review.
-
Cell Death in Hepatocellular Carcinoma: Pathogenesis and Therapeutic Opportunities.Cancers (Basel). 2021 Dec 23;14(1):48. doi: 10.3390/cancers14010048. Cancers (Basel). 2021. PMID: 35008212 Free PMC article. Review.
References
-
- Fridman WH, Pagès F, Sautès-Fridman C, Galon J. The immune contexture in human tumours: Impact on clinical outcome. Nat Rev Cancer. 2012;12:298–306. - PubMed
-
- Makarova-Rusher OV, Medina-Echeverz J, Duffy AG, Greten TF. The yin and yang of evasion and immune activation in HCC. J Hepatol. 2015;62:1420–1429. - PubMed
-
- Couzin-Frankel J. Breakthrough of the year 2013. Cancer immunotherapy. Science. 2013;342:1432–1433. - PubMed
-
- Errico A. Immunotherapy: PD-1-PD-L1 axis: Efficient checkpoint blockade against cancer. Nat Rev Clin Oncol. 2015;12:63. - PubMed
Publication types
MeSH terms
Substances
LinkOut - more resources
Full Text Sources
Other Literature Sources
Medical
Research Materials

