. 2017 Jun 28:8:15865.
doi: 10.1038/ncomms15865.

E3 Ubiquitin ligase ZNRF4 negatively regulates NOD2 signalling and induces tolerance to MDP

Affiliations

E3 Ubiquitin ligase ZNRF4 negatively regulates NOD2 signalling and induces tolerance to MDP

Pradeep Bist et al. Nat Commun. .

Erratum in

Abstract

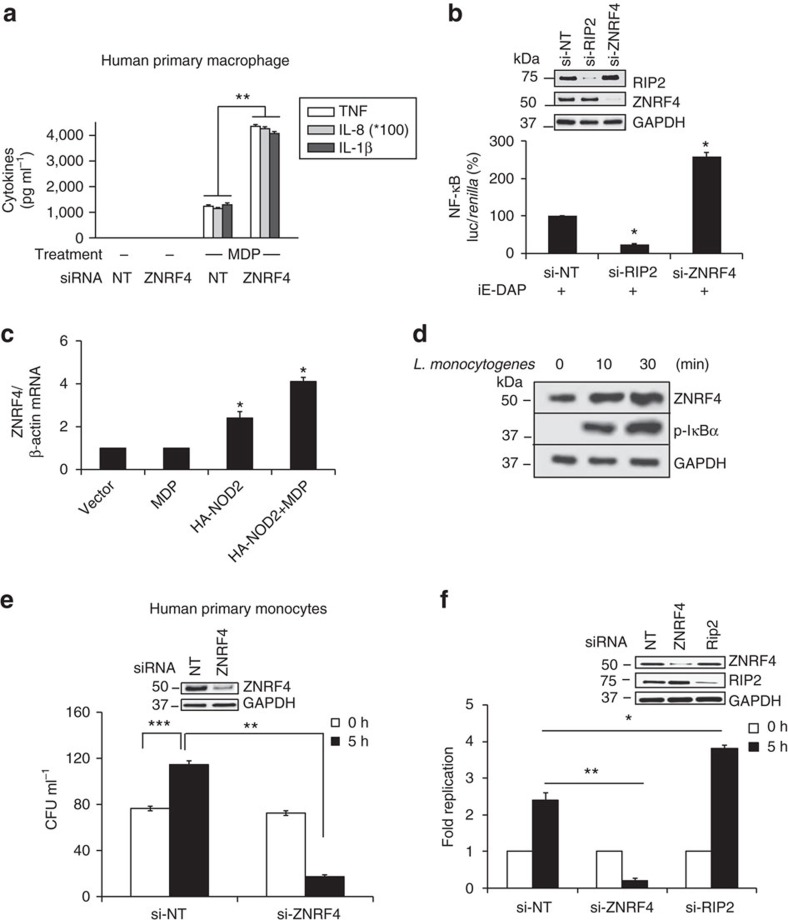
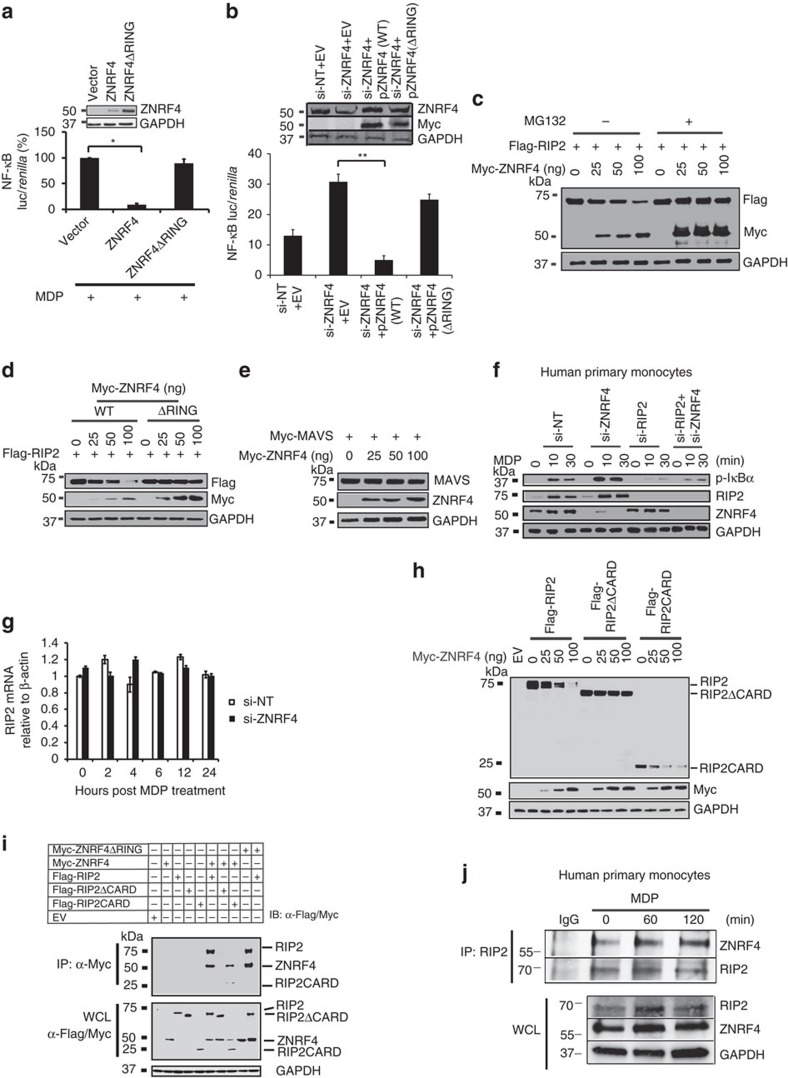
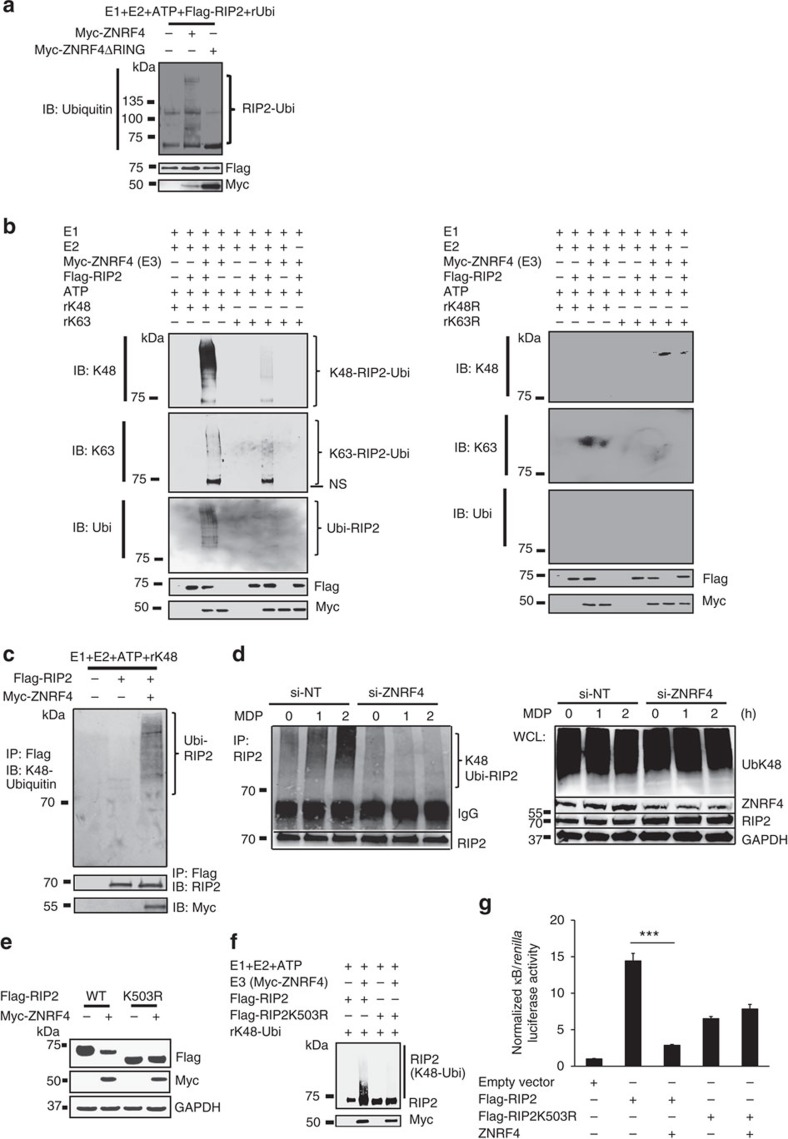
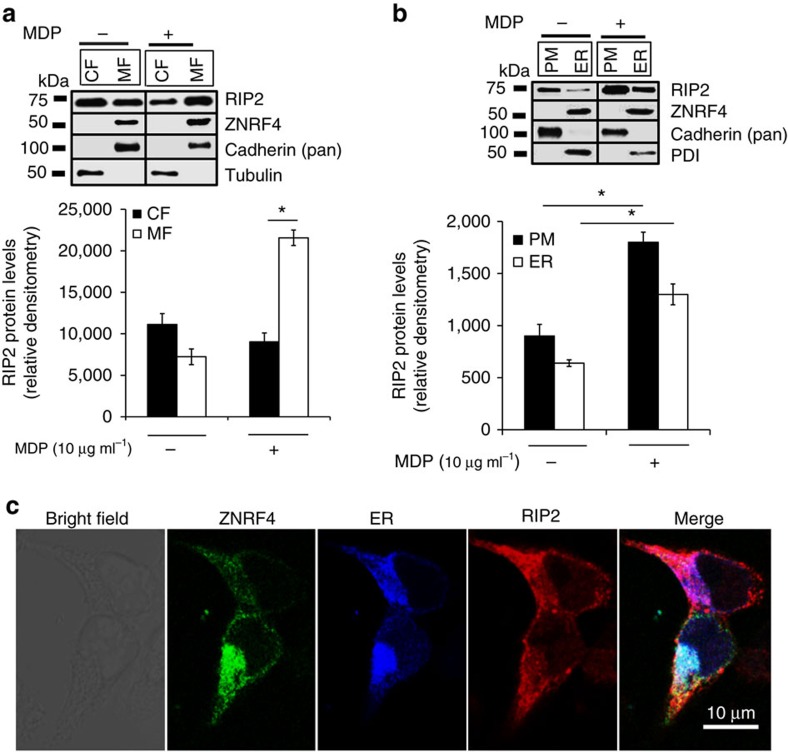
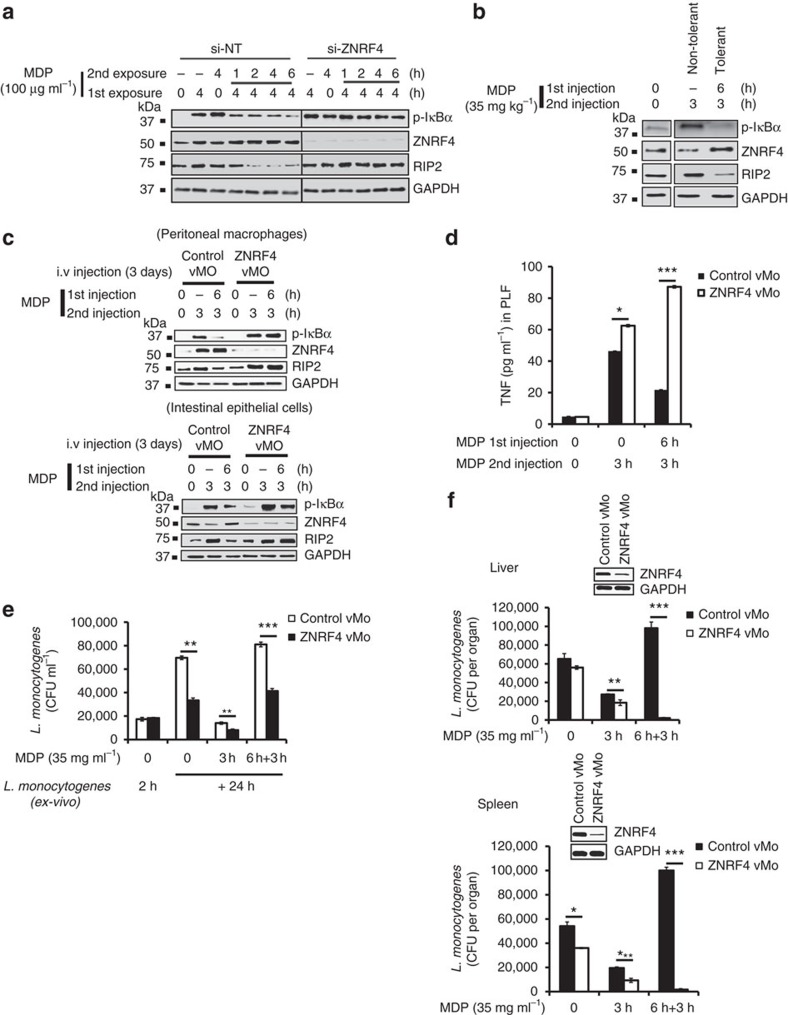
Optimal regulation of the innate immune receptor nucleotide-binding oligomerization domain-containing protein 2 (NOD2) is essential for controlling bacterial infections and inflammatory disorders. Chronic NOD2 stimulation induces non-responsiveness to restimulation, termed NOD2-induced tolerance. Although the levels of the NOD2 adaptor, RIP2, are reported to regulate both acute and chronic NOD2 signalling, how RIP2 levels are modulated is unclear. Here we show that ZNRF4 induces K48-linked ubiquitination of RIP2 and promotes RIP2 degradation. A fraction of RIP2 localizes to the endoplasmic reticulum (ER), where it interacts with ZNRF4 under either 55 unstimulated and muramyl dipeptide-stimulated conditions. Znrf4 knockdown monocytes have sustained nuclear factor kappa-light-chain-enhancer of activated B cells (NF-κB) activation, and Znrf4 knockdown mice have reduced NOD2-induced tolerance and more effective control of Listeria monocytogenes infection. Our results thus demonstrate E3-ubiquitin ligase ZNRF4-mediated RIP2 degradation as a negative regulatory mechanism of NOD2-induced NF-κB, cytokine and anti-bacterial responses in vitro and in vivo, and identify a ZNRF4-RIP2 axis of fine-tuning NOD2 signalling to promote protective host immunity.


Conflict of interest statement

The authors declare no competing financial interests.

Figures

Figure 1
Figure 1. Genome-wide RNAi screening and results analysis.
RNAi screen methodology to identify novel regulatory genes regulating NOD2-induced NF-κB activation.
Figure 2
Figure 2. ZNRF4 negatively regulates NOD2-mediated NF-κB activation.
(a) NF-κB luciferase activity in unstimulated or MDP-stimulated HEK293T-NOD2 cells transfected with si-NT or siRNA targeting ZNRF4 (four unique siRNAs (1, 2, 3 or 4) and pooled siRNA). Immunoblotting (inset panel) confirmed gene silencing. *P≤0.05 compared with MDP-stimulated si-NT values. (b) qRT–PCR analysis of ZNRF4 mRNA levels following ZNRF4 gene silencing in HEK293T cells (normalized with β-actin). (c) Immunoblot to show the effects of ZNRF4 gene silencing on MDP-induced NF-κB activation (by measuring p-IκBα levels) in human primary monocytes (CD14+, top panel) and HCT116 cell line (bottom panel). (d) NF-κB luciferase activity in HCT116 cells transfected with si-NT or si-ZNRF4, and stimulated with the ligands MDP (10 μg ml−1), pIC (5 μg ml−1), TNF (10 ng ml−1) or lipopolysaccharide (100 ng ml−1) for 24 h. (e) NF-κB luciferase activity in MDP-treated HEK293T-NOD2 cells, transfected with vector control or indicated amounts of plasmid encoding ZNRF4. Inset panel: expression levels of ZNRF4. (f) Immunoblot to show the effect of ZNRF4 gene silencing on MDP-induced IκBα, extracellular signal-regulated kinase (ERK1/2), p38 and Jun N-terminal kinase phosphorylation in human primary monocytes (CD14+). **P≤0.01, *P≤0.05. Significance was assessed using Student’s t-test. Data are representative of (c and f) three independent experiments with similar results or represent the mean±s.d. of (a,b,d,e) three independent experiments. si, siRNA; si-NT, non-targeting negative control siRNA; UI, uninduced.
Figure 3
Figure 3. ZNRF4 negatively regulates MDP-induced proinflammatory response and host control of bacterial infection.
(a) IL-8, TNF and IL-1β secretion in ZNRF4 knockdown human primary macrophages following MDP treatment. (b) NF-κB luciferase activity in iE-DAP-stimulated HEK293T-NOD1 cells transfected with si-NT, si-ZNRF4 or si-RIP2. (c) Quantitative RT–PCR analysis to measure transcript levels of ZNRF4 in MDP-treated HEK293T cells with and without NOD2 overexpression. Data are normalized to β-actin gene. (d) Immunoblot to measure the protein expression levels of ZNRF4 in human primary monocytes with L. monocytogenes stimulation. (e,f) CFU assay to measure the intracellular bacterial load in (e) human primary monocytes and (f) HCT116 cells transfected with si-NT, or si-ZNRF4 on bacterial infection. Si-RIP2=positive control. The results of (e,f) are represented as CFU ml−1 or as the fold replication of bacteria (at 5 h after infection in comparison with 0 h) respectively. Knockdown efficiency is shown by western blot (inset). *P<0.05 and **P<0.01. Significance was assessed using (ac) Student’s t-test or (e,f) one-way analysis of variance (ANOVA). Data represent mean±s.e.m. from (a) three independent experiments (compared with si-NT sample with MDP stimulation) or mean±s.d. from (b,c,e,f) three independent experiments or representative of (d) three independent experiments with similar results. si, siRNA; si-NT, non-targeting negative control siRNA.
Figure 4
Figure 4. ZNRF4 interacts with and promotes degradation of RIP2.
(a) NF-κB luciferase reporter activity (relative to internal control Renilla luciferase activity) in HEK293T-NOD2 cells transfected with WT ZNRF4 or RING mutant (ZNRF4ΔRING) plasmids, following MDP stimulation. Immunoblotting confirmed the expression of various proteins (inset panel). (b) NF-κB luciferase activity in MDP-stimulated HCT116 cells transfected with si-NT or si-ZNRF4 (targeting the 3′-UTR of ZNRF4), followed by transfection with plasmid (Myc-tagged) encoding either WT ZNRF4 (pZNRF4(WT)) or RING mutant of ZNRF4 (pZNRF4(ΔRING)). All NF-κB luciferase values were normalized with Renilla luciferase activity. (ce) Immunoblot of extracts of HEK293 cells transfected with expression plasmids for (c,d) Flag-RIP2 (250 ng) and increasing amounts of (c) Myc-ZNRF4 (25–100 ng) and treated with DMSO or MG-132 or (d) either WT or RING mutant (ΔRING) Myc-ZNRF4 and (e) HA-MAVS and Myc-ZNRF4. (f) Human primary monocytes (CD14+) treated with ZNRF4-specific siRNA (si-ZNRF4), si-RIP2, si-ZNRF4+siRIP2 or si-NT and stimulated with MDP (10 μg ml−1) for the indicated times and immunoblotted for the indicated proteins. GAPDH=loading control. (g) Quantitative RT–PCR analysis of RIP2 mRNA in si-ZNRF4 or si-NT treated HCT116 cells following MDP stimulation. (h) Immunoblot of extracts of HEK293 cells expressing Flag-RIP2, Flag-RIP2ΔCARD or Flag-RIP2CARD (250 ng each) with Myc-ZNRF4. (i) Co-immunoprecipitation (top panel) and lysates (bottom panel) of HEK293 cells expressing Flag-RIP2, Flag-RIP2ΔCARD or Flag-RIP2CARD along with Myc-ZNRF4 or Myc-ZNRF4ΔRING. (j) Co-immunoprecipitation with RIP2 (top panel) and lysates (bottom panel) of human primary monocytes (CD14+) cells treated with MDP for various time points. (a,b,g) Data represent mean±s.d. of triplicate samples and are representative of three independent experiments. *P<0.05 and **P<0.01. Significance was assessed using Student’s t-test. Experiments (cf and hj) were repeated three times with similar results. Representative blots are shown. EV, vector control; si, siRNA; si-NT, non-targeting negative control siRNA.
Figure 5
Figure 5. ZNRF4 mediates RIP2 ubiquitination via K48-specific ubiquitin linkages.
Immunoblot analysis of (a) total ubiquitination and (b) K48-mediated and K63-mediated ubiquitination of Flag-RIP2 assessed by in vitro ubiquitination assay with various combinations of a mixture of E1 enzyme, E2 enzymes, ATP, recombinant Ub (rUbi), recombinant ubiquitin K48/K48R, K63/K63R, Myc-ZNRF4 (100 ng) or Myc-ZNRF4ΔRING (100 ng). NS represents nonspecific band. (c) K48-mediated ubiquitination of RIP2 by ZNRF4 assessed following immunoprecipitation of RIP2 from the in vitro ubiquitination reaction mix containing a mixture of E1 and E2 enzymes, ATP, recombinant ubiquitin K48 and Myc-ZNRF4. (d) HCT116 cells were transfected with either NT-siRNA or ZNRF4-siRNA. After 2 days, cells were transfected with HA-ubiquitin. The next day, cells were stimulated with MDP for various time points and cell lysates were subjected to immunoprecipitation using and anti-RIP2 antibody and immunoblotted with anti-K48-ubiquitin antibody. (e) Immunoblot analysis of extracts of HEK293 cells transfected with expression plasmids of Flag-RIP2 or Flag-RIP2K503R mutant in the presence or absence of Myc-ZNRF4. (f) Immunoblot analysis of K48-mediated, ubiquitination of Flag-RIP2 or Flag-RIP2K503R mutant assessed by in vitro ubiquitination assay with various combinations of a mixture of E1 enzyme, E2 enzymes, ATP, recombinant ubiquitin K48 and Myc-ZNRF4. (g) Activation of NF-κB promoter in HCT116 cells transfected with NF-κB luciferase reporter and expression vectors of Flag-RIP2 or Flag-RIP2K503R mutant and ZNRF4 (untagged). The results are normalized to that of Renilla luciferase. (g) Data represent the mean±s.d. of three independent experiments performed in triplicate. ***P<0.001. Significance was assessed using Student’s t-test. Experiments (af) were repeated three times with similar results. Representative blots are shown.
Figure 6
Figure 6. RIP2 colocalizes with ZNRF4 at the ER.
(a,b) Immunoblot analysis for RIP2 from various cellular fractions of HCT116 cells stimulated with MDP for 30 min. The cells were fractionated to separate (a) cytoplasmic (CF), membrane (MF) or (b) plasma membrane (PM), endoplasmic reticulum (ER) fractions, respectively. Equal amount of each fraction (30 μg) was analysed by western blot. Relative densitometric data (using ImageJ) of RIP2 levels in various fractions is shown in the bottom panels (n=3). (c) Confocal microscopy of HCT116 cells expressing RIP2-HA (red), YFP-ZNRF4 (green) and pmTurquoise2-ER (ER marker-blue). EV, vector control. Images were acquired at × 63 optical magnification. Scale bars, 10 μm. Western blots and confocal images are representative of one of three independent experiments that were conducted. *P<0.05. Significance was assessed using Student’s t-test. si-NT, non-targeting negative control siRNA. Protein disulfide isomerase (PDI)=marker for ER; cadherin (pan)=marker for PM.
Figure 7
Figure 7. ZNRF4-mediated RIP2 degradation is needed for the NOD2-induced tolerance.
(ac) Immunoblot analysis of (a) differentiated THP-1 cells that were exposed to ZNRF4-siRNA (si-ZNRF4) or non-targeting siRNA (si-NT) followed by MDP pre-treatment, and re-treatment with MDP for the indicated time intervals to induce NOD2 tolerance. (b) Murine peritoneal macrophages during MDP tolerance induction in vivo. Thioglycollate-treated mice (C57BL/6) were given MDP (35 mg kg−1) intraperitoneally: MDP-tolerant group first received an MDP injection for 6 h and then a second injection for 3 h. The non-tolerant group received only the second injection of MDP. Control mice received thioglycollate only. After the second MDP stimulation, peritoneal cavity macrophages were collected by lavage and lysed for western blot analysis. (c) In vivo Znrf4 knockdown abrogates NOD2 tolerance induction. Thioglycollate-treated mice received intravenously either vMO targeting murine ZNRF4 (ZNRF4 vMO) or vMO standard control (control vMO), followed by the MDP treatment on day 4 for the indicated time points, and tissues (murine peritoneal macrophages and intestinal epithelial cells) were collected. (c) Western blots on lysates or (d) ELISA for TNF in peritoneal lavage fluid was performed. (e,f) Thioglycollate-treated mice (n=3 mice per group) received intravenously ZNRF4 vMO or control vMO. On the fourth day, MDP- or endotoxin-free PBS was injected intraperitoneally for the indicated time points. After the last injection of MDP, (e) peritoneal lavage was collected, and infected ex vivo with L. monocytogenes (MOI=1) for the indicated time points. The cells were lysed, and the bacterial load was measured as CFU ml−1 or (f) mice were infected intraperitoneallywith L. monocytogenes. At 24 h after infection, mice were killed, and the liver/spleen were analysed for bacteria quantification. The bacterial load was measured as CFU per organ. Western blot (inset) shows the knockdown efficiency. *P<0.05, **P<0.01 and ***P<0.001. Significance was assessed using Student’s t-test. Data are representative of (a,b,e) three independent experiments or (c,d,f) two independent experiments with similar results. (c,f) Mean±s.d. of (c) four or (f) three mice. si, siRNA; si-NT, non-targeting negative control siRNA.

Similar articles

Cited by

References

    1. Girardin S. E. et al.. Nod2 is a general sensor of peptidoglycan through muramyl dipeptide (MDP) detection. J. Biol. Chem. 278, 8869–8872 (2003). - PubMed
    1. Inohara N. et al.. Host recognition of bacterial muramyl dipeptide mediated through NOD2. Implications for Crohn's disease. J. Biol. Chem. 278, 5509–5512 (2003). - PubMed
    1. Lecat A., Piette J. & Legrand-Poels S. The protein Nod2: an innate receptor more complex than previously assumed. Biochem. Pharmacol. 80, 2021–2031 (2010). - PubMed
    1. Chen G., Shaw M. H., Kim Y. G. & Nunez G. NOD-like receptors: role in innate immunity and inflammatory disease. Annu. Rev. Pathol. 4, 365–398 (2009). - PubMed
    1. Franchi L., Warner N., Viani K. & Nunez G. Function of Nod-like receptors in microbial recognition and host defense. Immunol. Rev. 227, 106–128 (2009). - PMC - PubMed

Publication types

MeSH terms